Temperature Increase
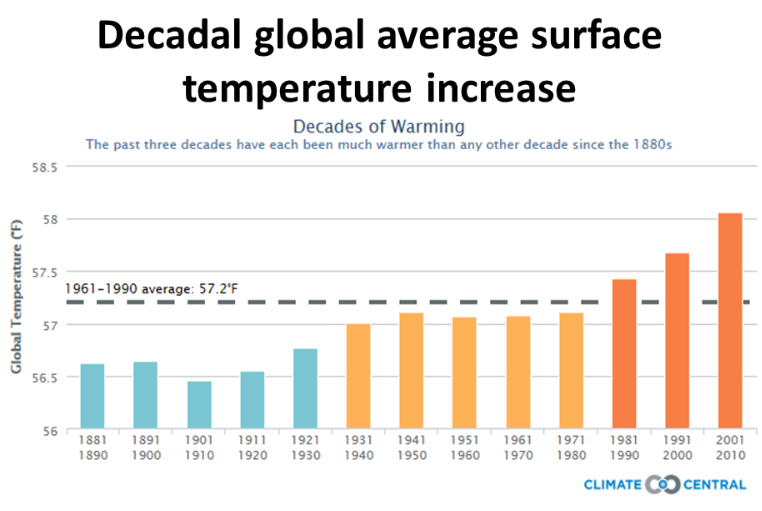
WMO on Warming page. Large decadal regional warming from the WMO's 2013 Global Climate 2001-10 Decade of Extremes
Oct 2013 Nature study reveals urgent new time frame for climate change-
the year when the lowest monthly dips in temperatures will be hotter than temperature records experienced in the past 150 years,
the year when the lowest monthly dips in temperatures will be hotter than temperature records experienced in the past 150 years,
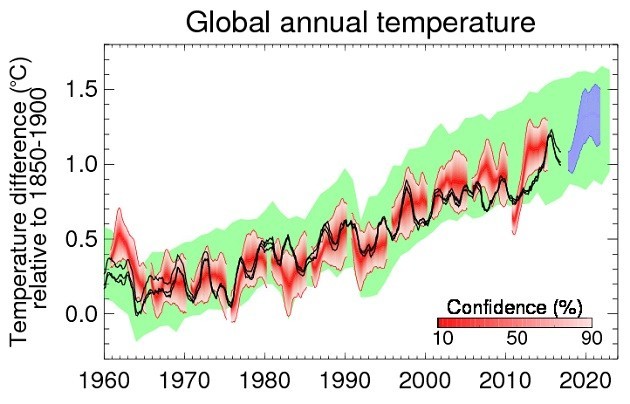
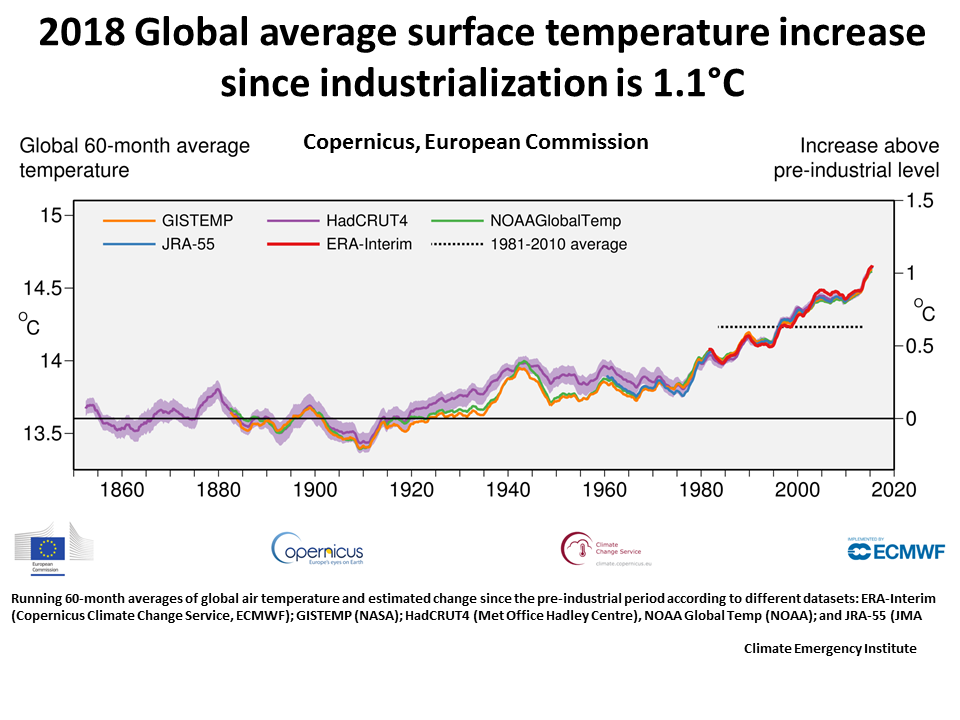
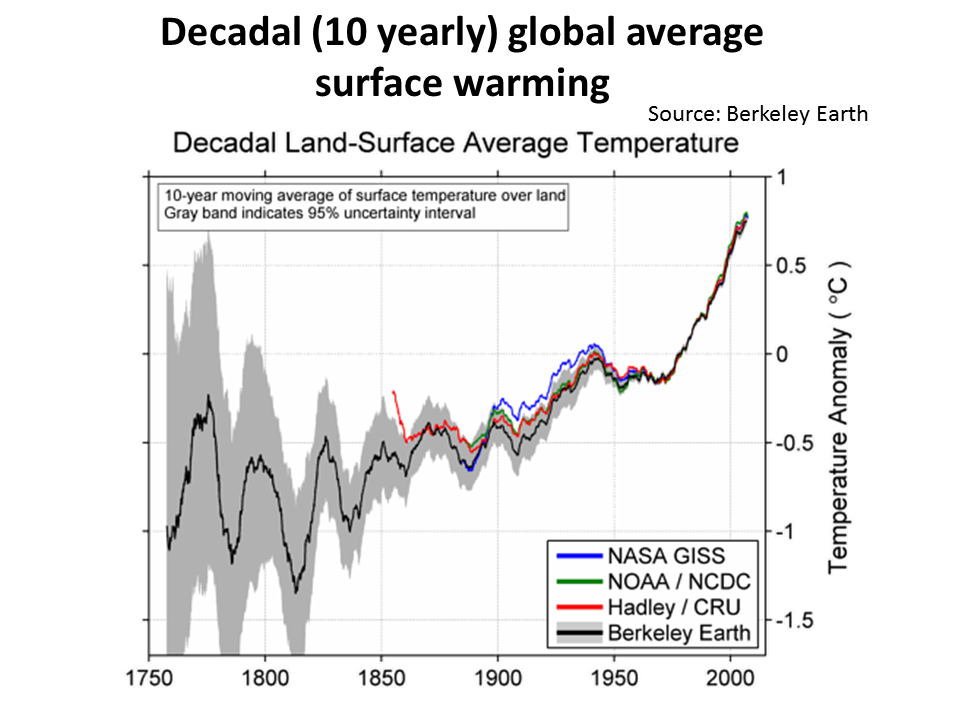
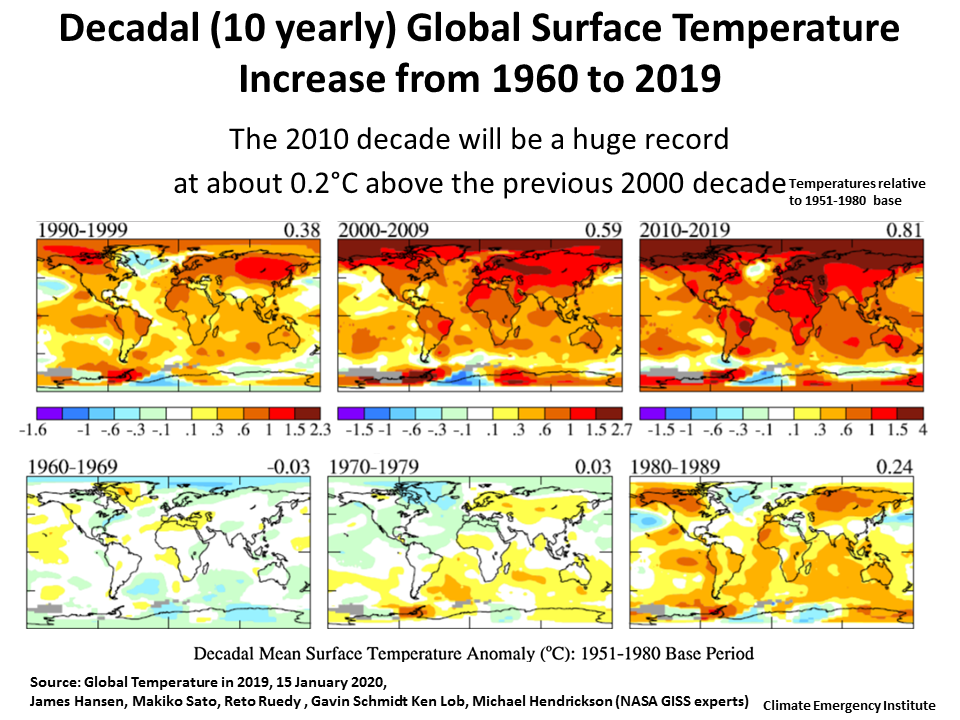
Global warming is defined as the
global average (land-sea) surface temperature increase, from pre-industrial
global average (land-sea) surface temperature increase, from pre-industrial

CLIMATE EMERGENCY INSTITUTE
The Health and Human Rights Approach to Climate Change
The Health and Human Rights Approach to Climate Change
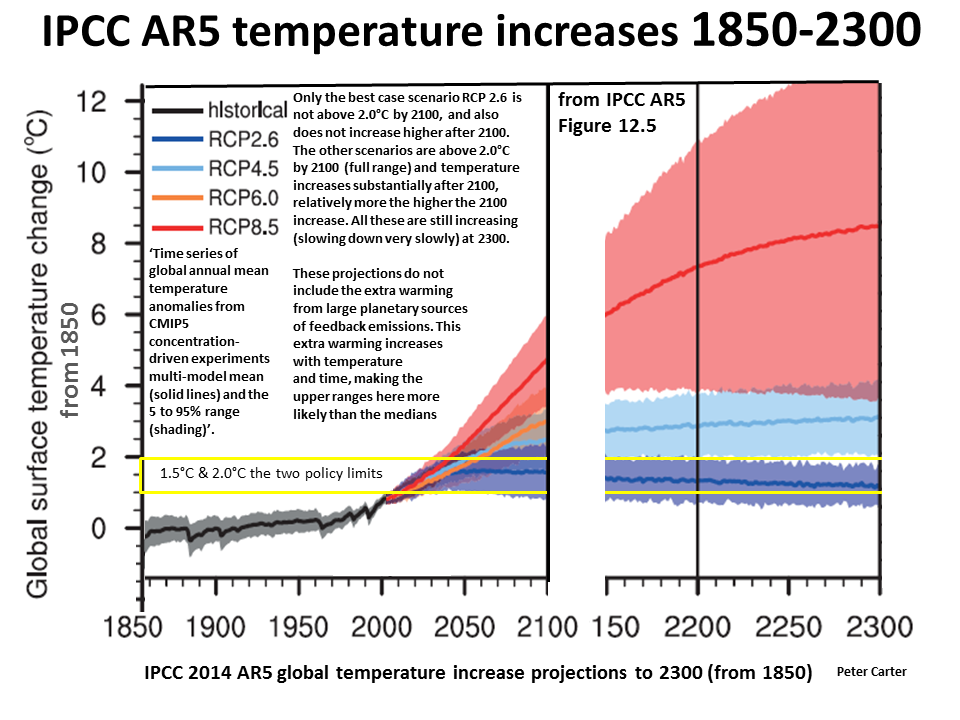
'The commitment from constant greenhouse gas concentrations would correspond to approximately 2C warming' (IPCC AR5 WG1 12.5.2).
8 May 2017 Trajectories toward the 1.5°C Paris target (2026)
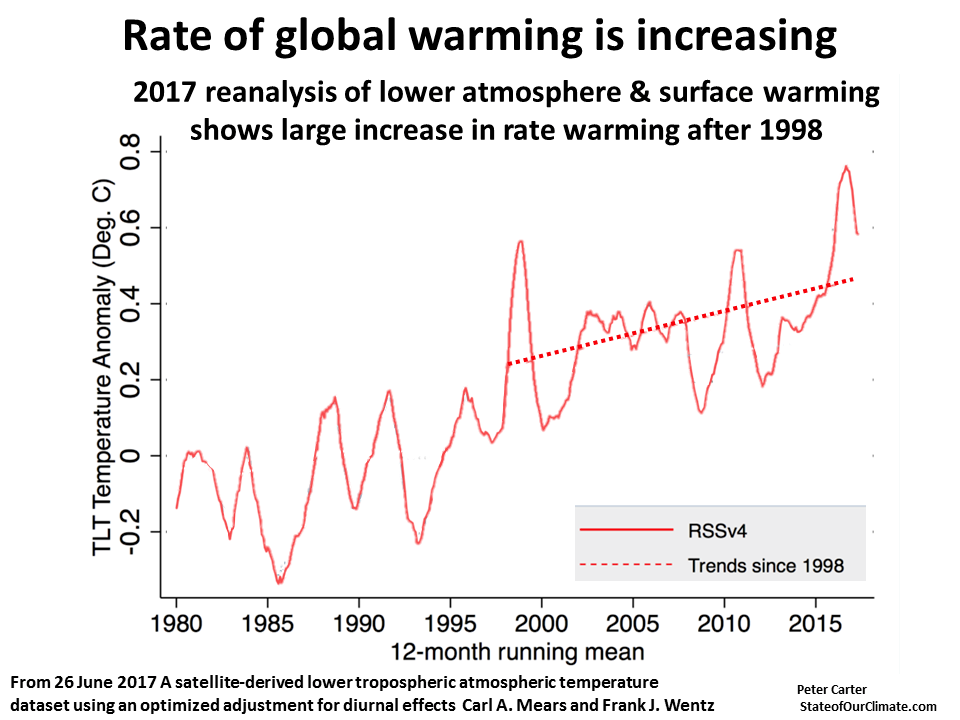
30 June 2017 Satellite research
confirms global warming
IS speeding up
confirms global warming
IS speeding up
Rapid global warming will continue
UK Met Office prediction to 2022.
UK Met Office prediction to 2022.
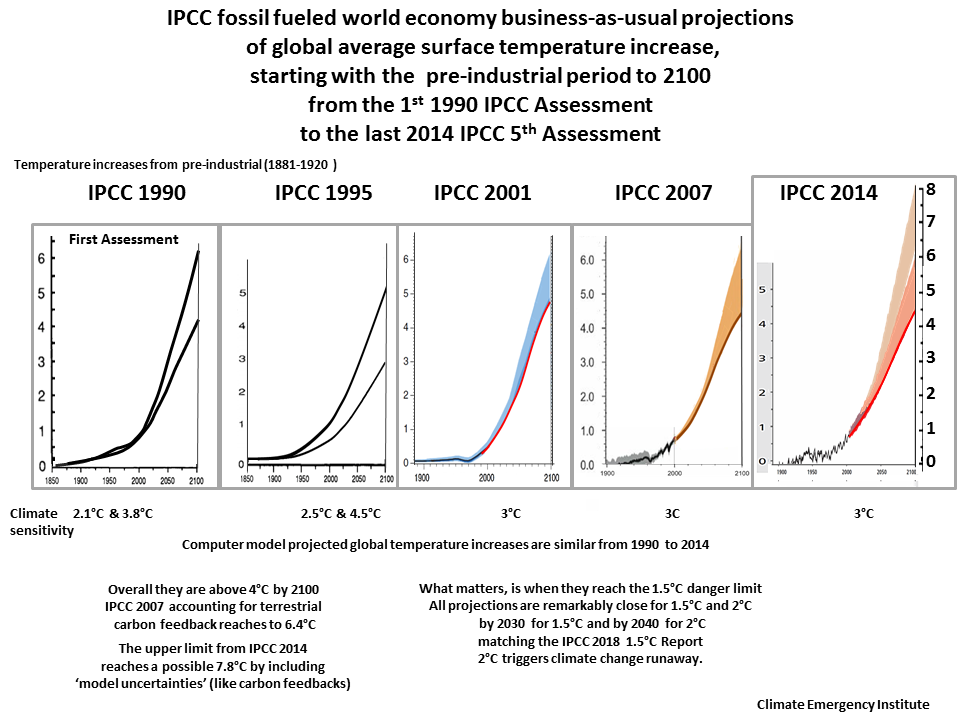
Land projection 2000 to 2100(high emission scenario)
Recent research
by date
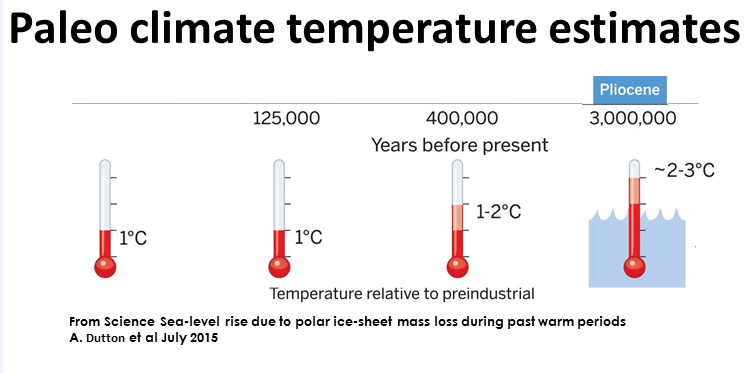
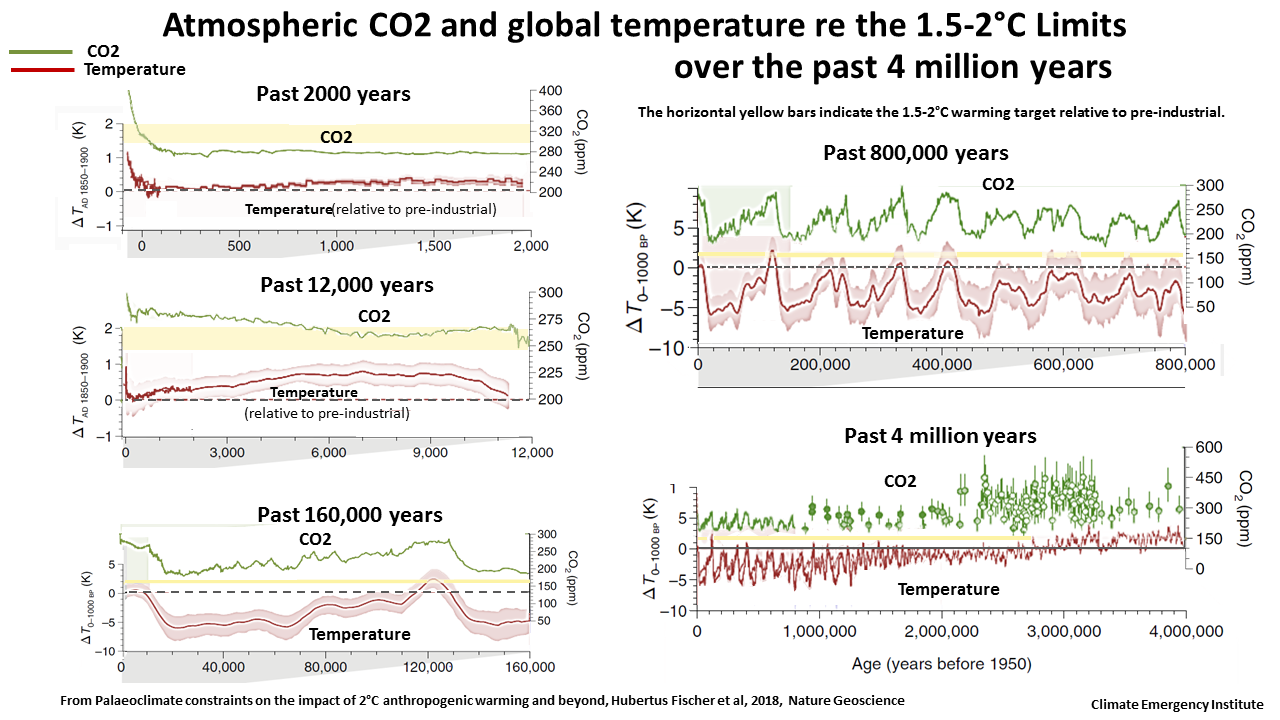
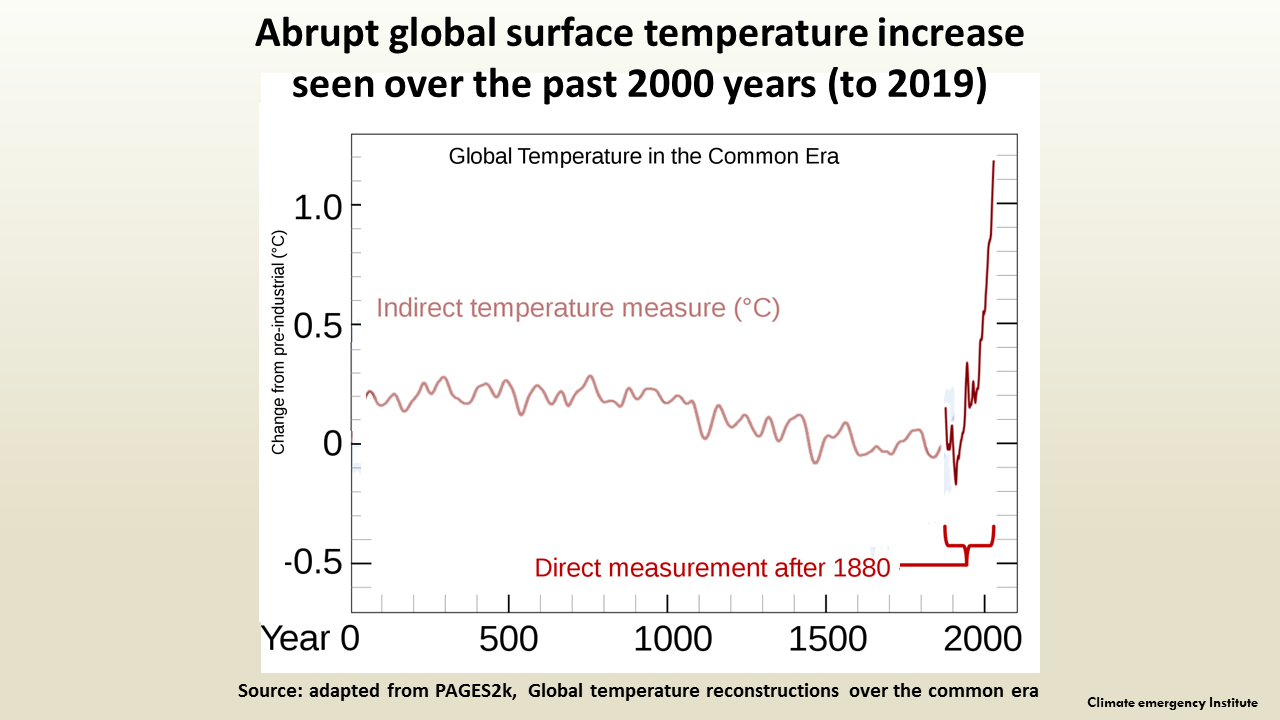
8 July 2020: 6,500 years of global cooling reversed by human warming. Last time 1C was 125,000 year ago
9 July 2020 Humanity on Track to Soon Hit 1.5ºC Paris Accord Limit as Atmospheric CO2 Nears Level Not Seen in 15 Million Years
by date
8 July 2020: 6,500 years of global cooling reversed by human warming. Last time 1C was 125,000 year ago
9 July 2020 Humanity on Track to Soon Hit 1.5ºC Paris Accord Limit as Atmospheric CO2 Nears Level Not Seen in 15 Million Years
25 Jan 2020 Radiative forcing of climate change from the Copernicus reanalysis
of atmospheric composition
of atmospheric composition
21 Oct 2019 Steep warming curve for Europe. New models: Europe will heat 1C from 1990 to 2020.
21 Oct 2019 Historical change of El Niño properties sheds light on future changes of extreme El Niño (more & more extreme boosting surface warming)
20 Feb 2019 Carbon Emissions: Anthropogenic Emissions Compared to PETM-Onset (now 10 X faster)
5 Dec 2018
Global warming will happen faster than we think
2018 Recent Study Shows Amplified Arctic Temperature Increase during Perceived Hiatus in Global Warming (and AGW acceleration)
2018 Recent Study Shows Amplified Arctic Temperature Increase during Perceived Hiatus in Global Warming (and AGW acceleration)
Recorded Global warming is higher :
>in the night-time than the day (March 10, 2016, Research) -
>in the night-time than the day (March 10, 2016, Research) -
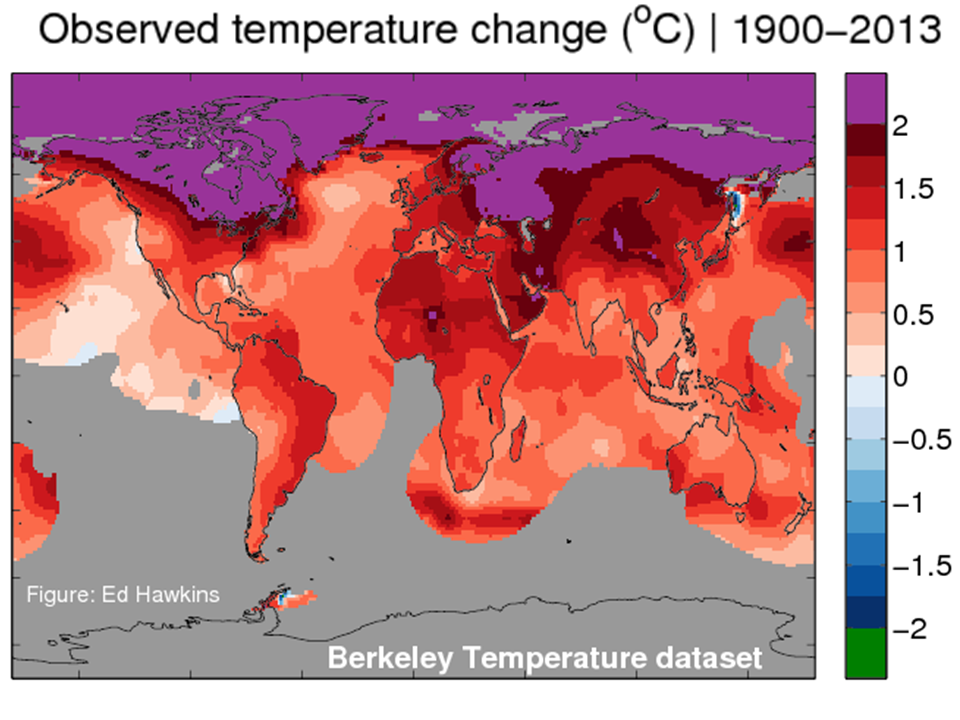
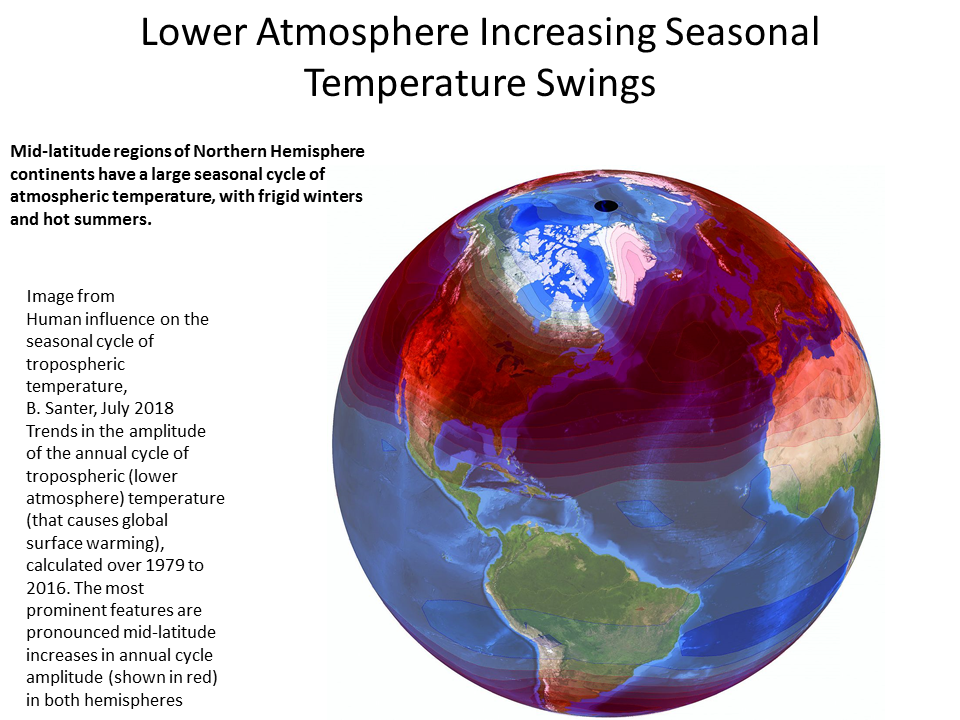
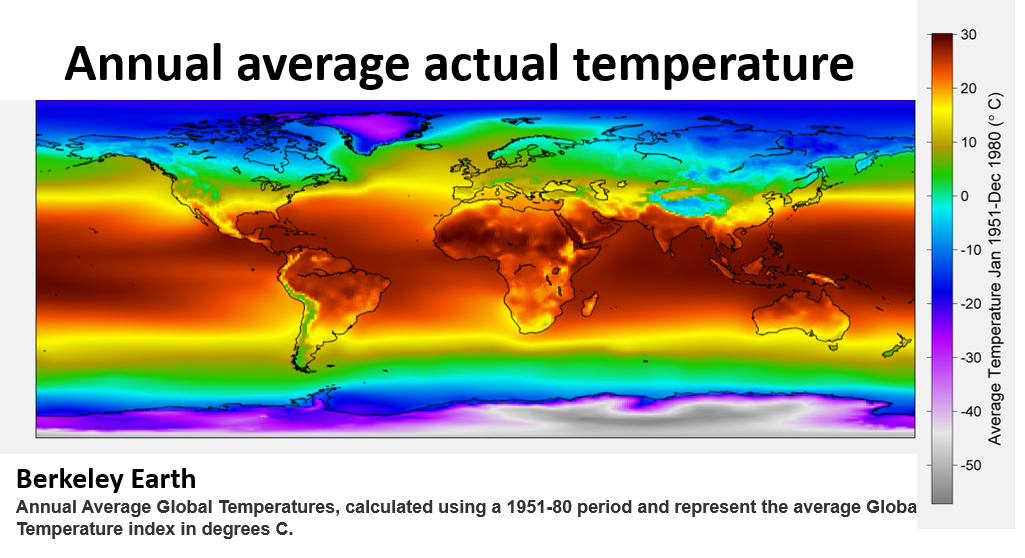
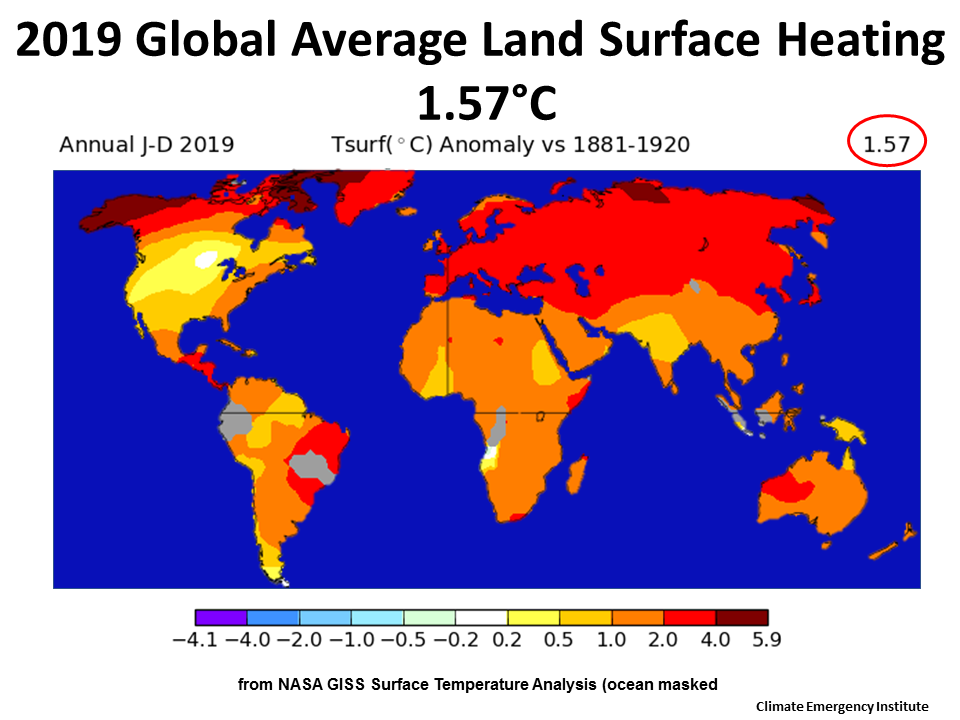
>over land than over sea (sea surface temperature)
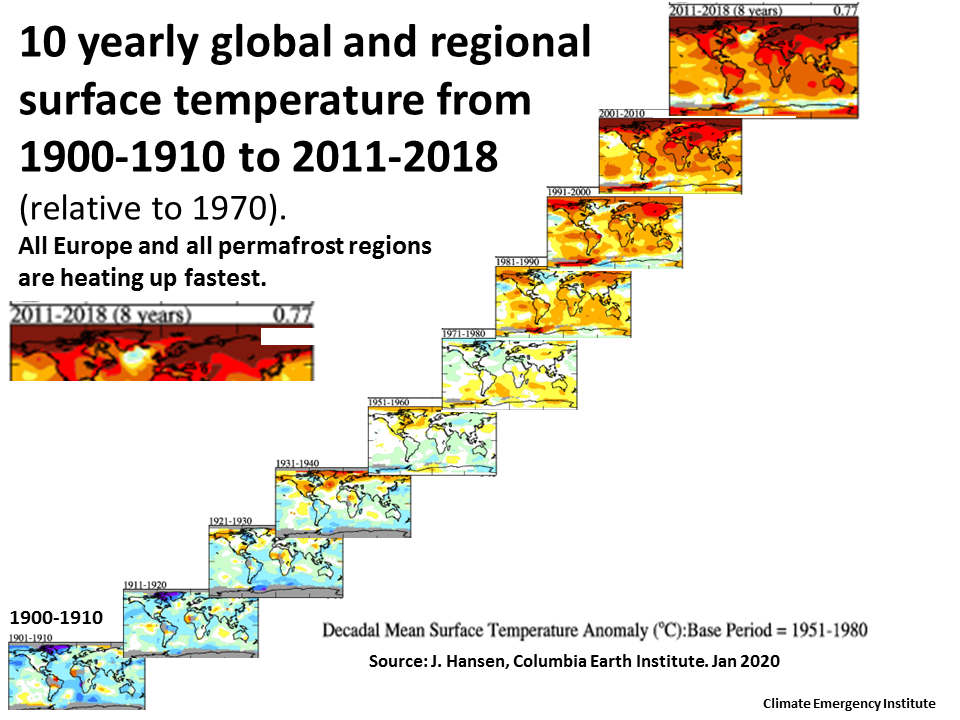
>over central continents
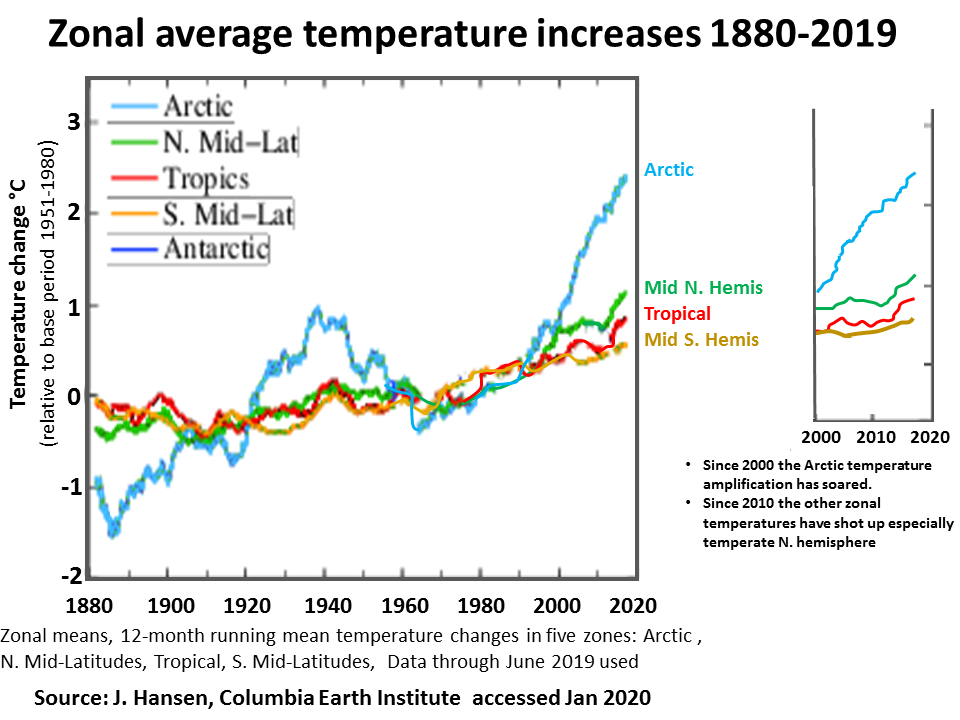
>in the northern hemisphere than southern and
> highest in the Arctic (feedback amplification)
>over central continents
>in the northern hemisphere than southern and
> highest in the Arctic (feedback amplification)
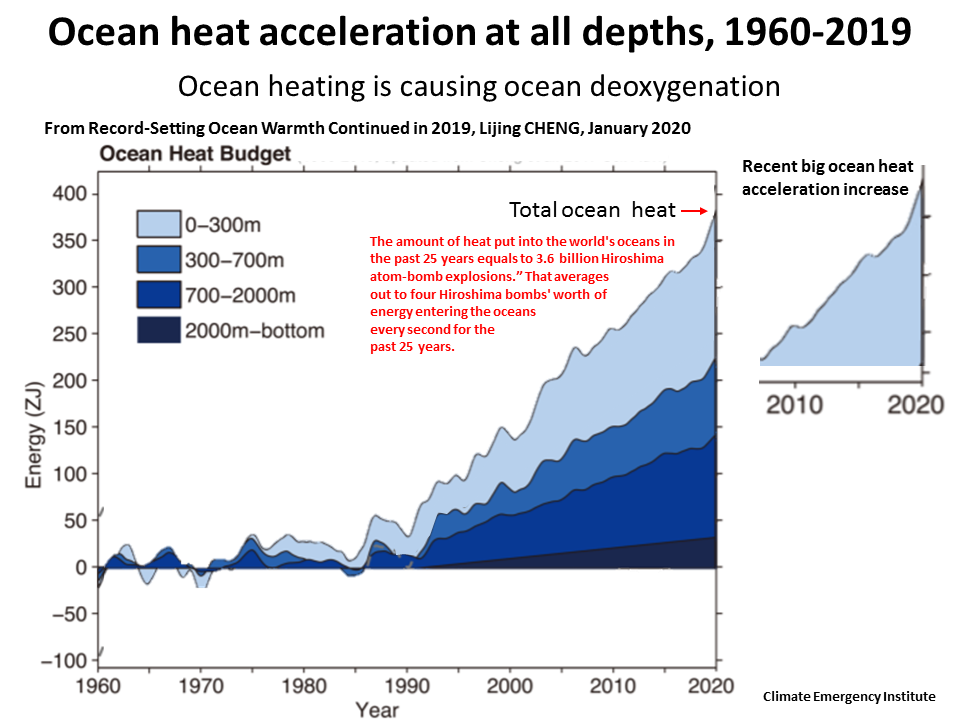
93% of added GHG heat has gone to the oceans, makes ocean heat a better single metric than global surface warming
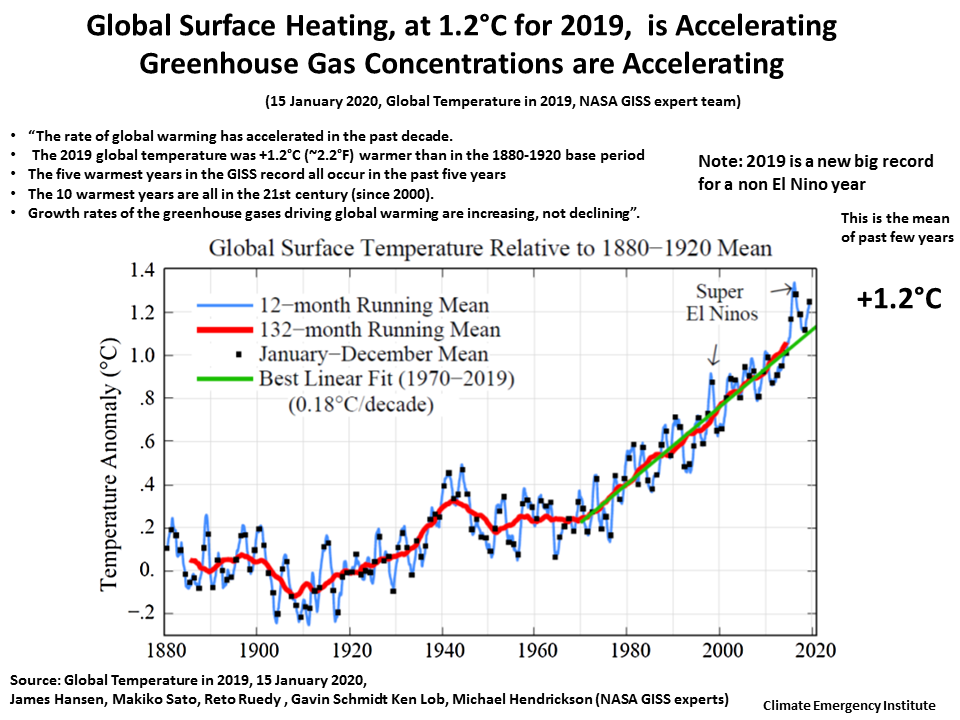
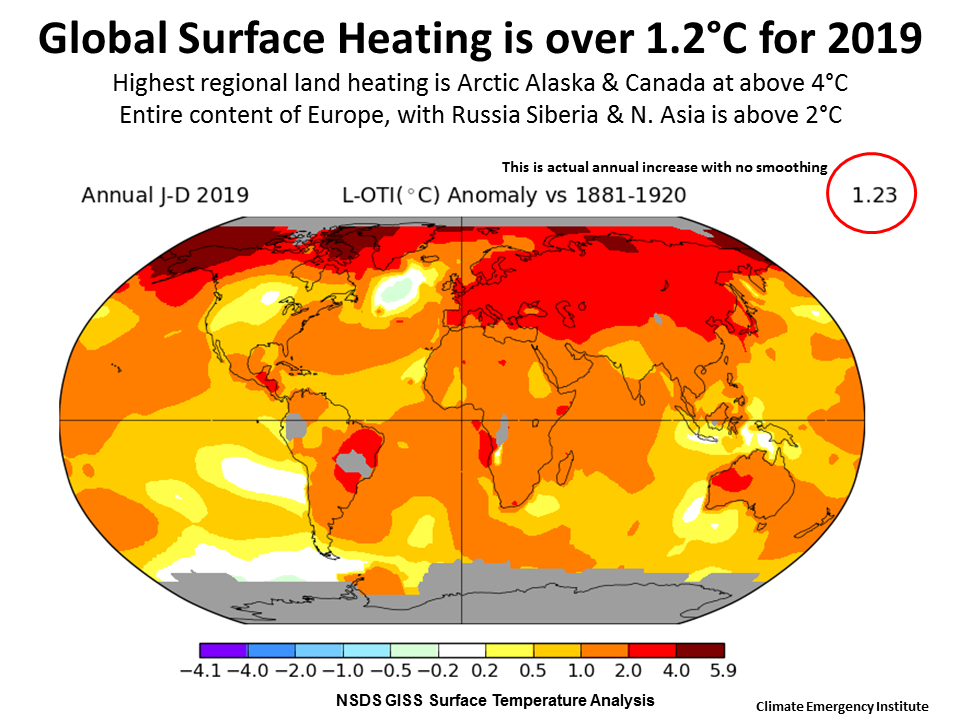
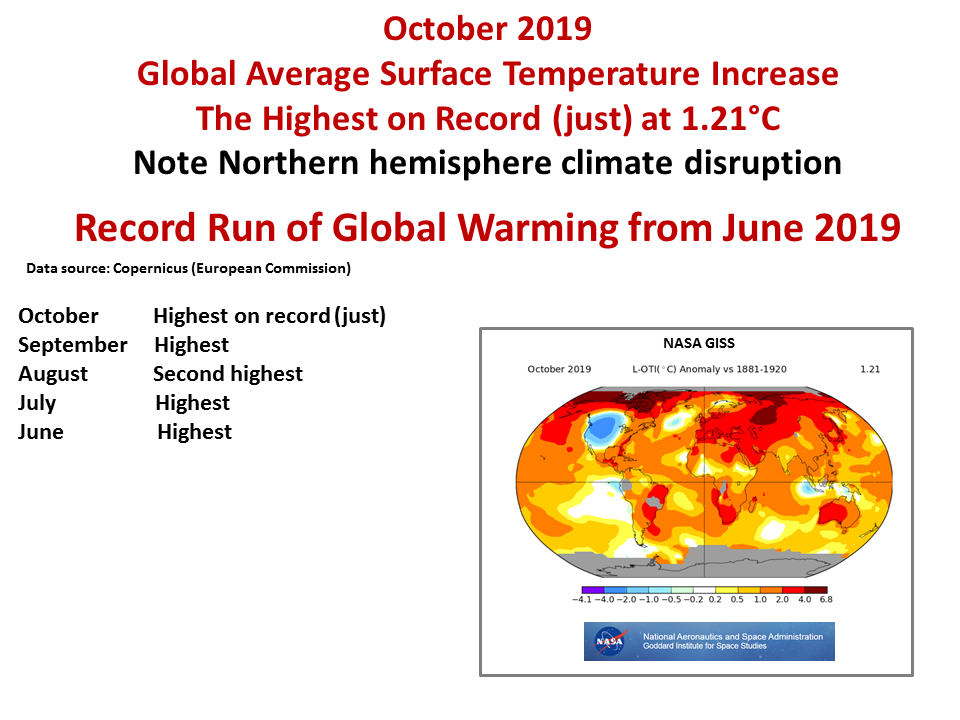
2019 from NASA expert team +1.2C
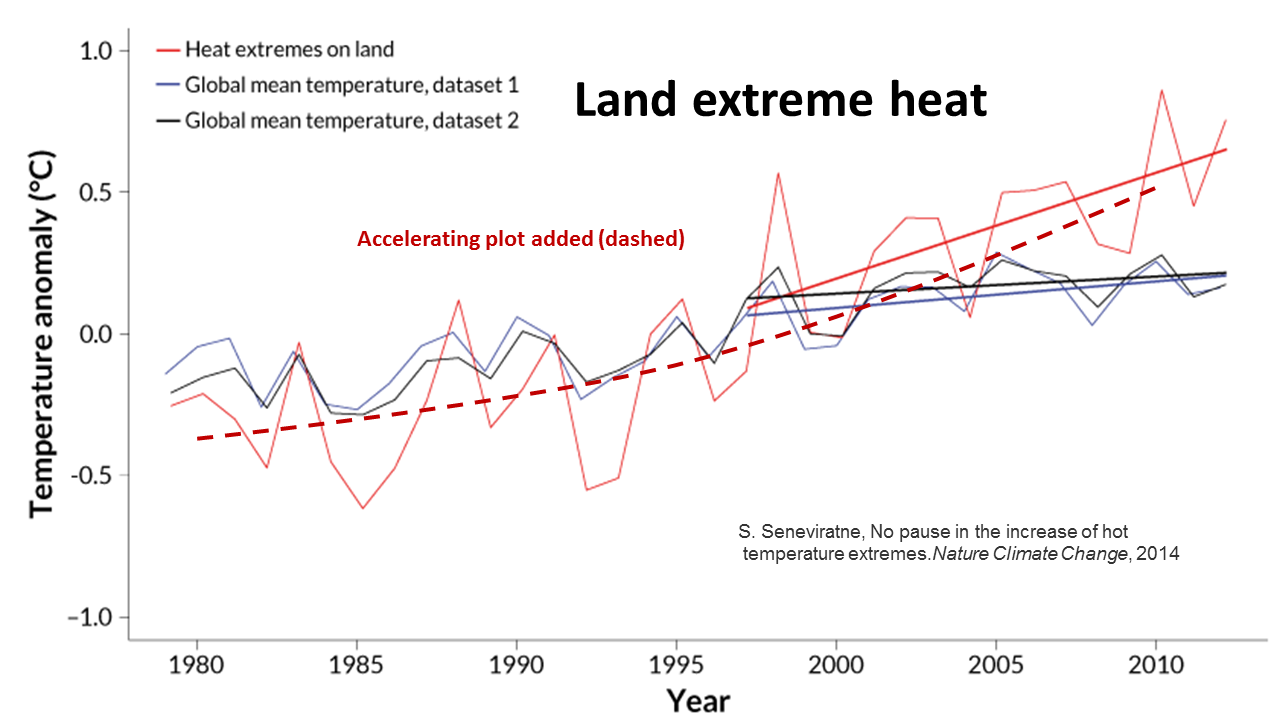
Global warming is ACCELERATING
NASA climate expert team, Climate Science, Awareness and Solutions
2019
Feb 2017 Global warming is 170X faster than natural long term background
July 2016 Temperature and atmospheric CO2 concentration
estimates through the PETM ... (mainly methane-subsea)
estimates through the PETM ... (mainly methane-subsea)
Radiative (heat) forcing is what we should be following, much more reliable as an indicator of atmospheric GHG pollution
See section below Temperature on this page
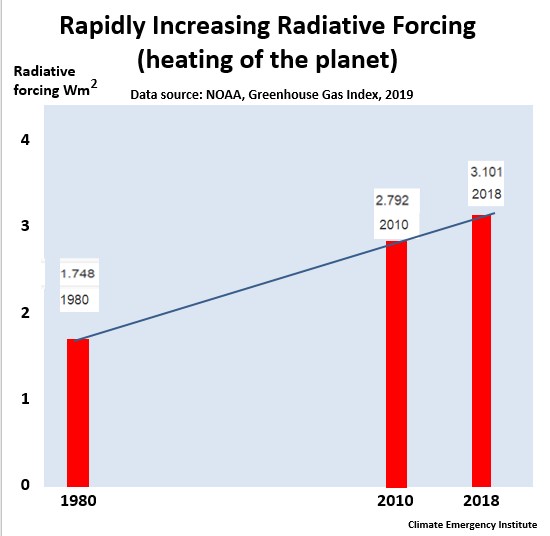
Radiative Forcing
Radiative Forcing (RF) is by far the best metric for following the effects of atmospheric GHG pollution, much better than the global surface warming (alone).
In addition to global surface warming, the RF includes heat gone to the oceans, heat melting snow and ice, and heat today that is a committed future increased surface warming.
RF is the planet energy situation when there is more energy from sun retained than energy radiated out to space, in which case (as now) the planet is out of energy balance. The planet is being forced to retain more heat energy.
For the 1,000 years before fossil fuel industrialization (1750 used by the IPCC) the planet was overall in energy balance. The stable period is the Holocene. forcing can change due to natural phenomena. Radiative forcing changes to bring on and end the ice ages (glacials). Volcanic eruptions have a temporary cooling effect due to emission of acid sulfate aerosols.
Radiative forcing is a complex calculation by the climate experts, with great uncertainty- it could be much higher than present estimates.
It has been and is continually increasing as the atmospheric GHG concentrations trap more heat in the lower atmosphere. The vast majority (93%) of this heat has gone to ocean heat.
Today radiative forcing is being increased due to the radiative forcing effects of our civilization's activities that emits greenhouse gases and aerosols. The GHG emissions and black carbon (soot) aerosol absorb and retain heat radiating from the planet surface. There is one cooling emission, which is air pollution acid sulfate emitted from fossil fuel combustion. Other human activities are clearing forests, and in doing so emit CO2 as well as eliminating annual CO2 uptake of the forest. The global surface warming melts snow and ice, which by their albedo effect of reflecting in coming solar energy back out to space, reduce the RF. As the area of snow, glaciers, sea ice and ice sheets declines so does the planet's albedo and the RF increases.
Today radiative forcing is being increased due to the radiative forcing effects of our civilization's activities that emits greenhouse gases and aerosols. The GHG emissions and black carbon (soot) aerosol absorb and retain heat radiating from the planet surface. There is one cooling emission, which is air pollution acid sulfate emitted from fossil fuel combustion. Other human activities are clearing forests, and in doing so emit CO2 as well as eliminating annual CO2 uptake of the forest. The global surface warming melts snow and ice, which by their albedo effect of reflecting in coming solar energy back out to space, reduce the RF. As the area of snow, glaciers, sea ice and ice sheets declines so does the planet's albedo and the RF increases.
The different greenhouse gases have different strengths of radiative forcing.
The vast majority of the added GHG heat has gone to ocean heat, simply because the oceans are 99% of the global environment living space for life. The global surface warming is a relatively small amount of heat that gets left over. So the heat content of the oceans is a much better atmospheric GHG indicator than global warming (alone) and correlates directly with the planet RF.
The RF can be used to calculate the RF contribution from different countries
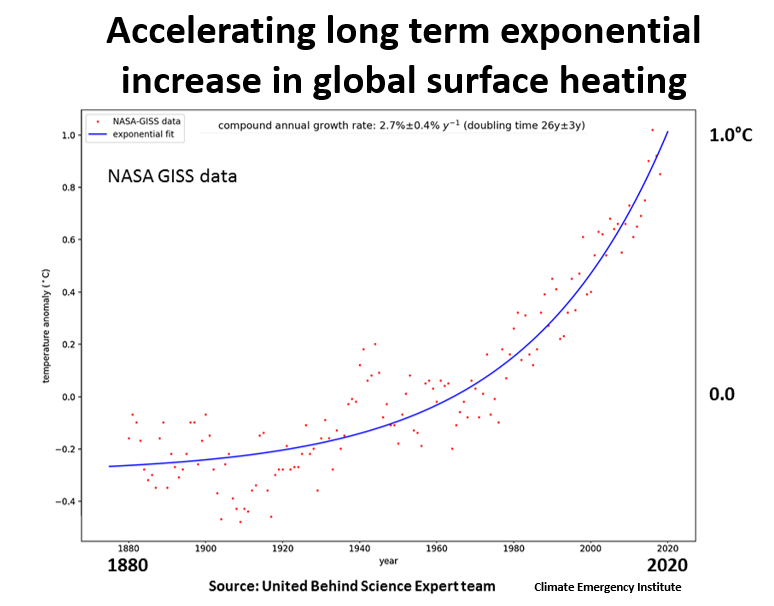
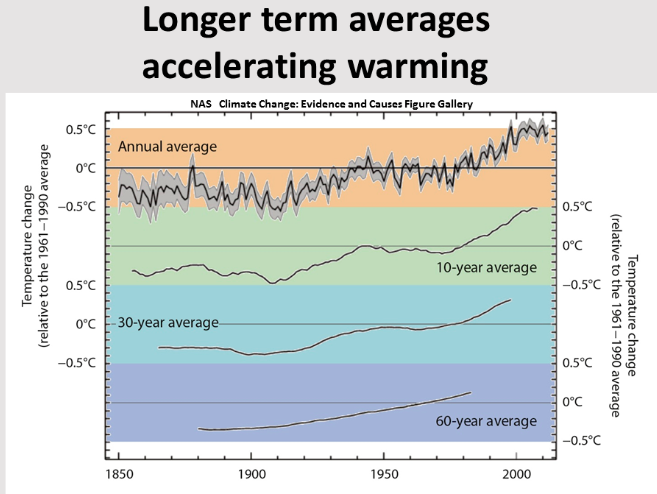
The global surface temperature change is clearly acceleratingsince the pre-industrial era starting with a rapid reversal of a cooling trend, is clearing accelerating since mid-century and as reported by NASA climate experts (Jan 2020) is accelerating even over just the past decade.
An exponential trend curve has been fitted to the full NASAS GISS data