Planetary Heating
Global warming
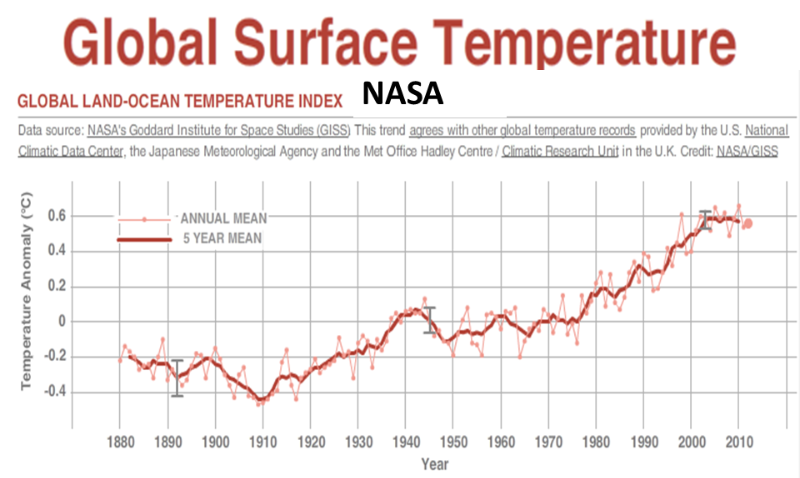
is defined as the global average increase in temperature near the Earths surface (EPA).
NOAA calls it the land-sea temperature increase as the vast ocean warms much slower that the land
As such it is only one indication of the heat energy added to the climate system by way of the lower atmosphere warming by an increase in atmospheric GHGs.
It is far from the best indicator to use as guide to the effects of atmospheric GHG pollution and policy making.
James Lovelock always used the term 'global heating' which is a better alternative.
A very early reference is from 1972 Stockholm UN Population and Environment conference that used 'atmospheric heating' which is accurate.
NASA Key Indicators
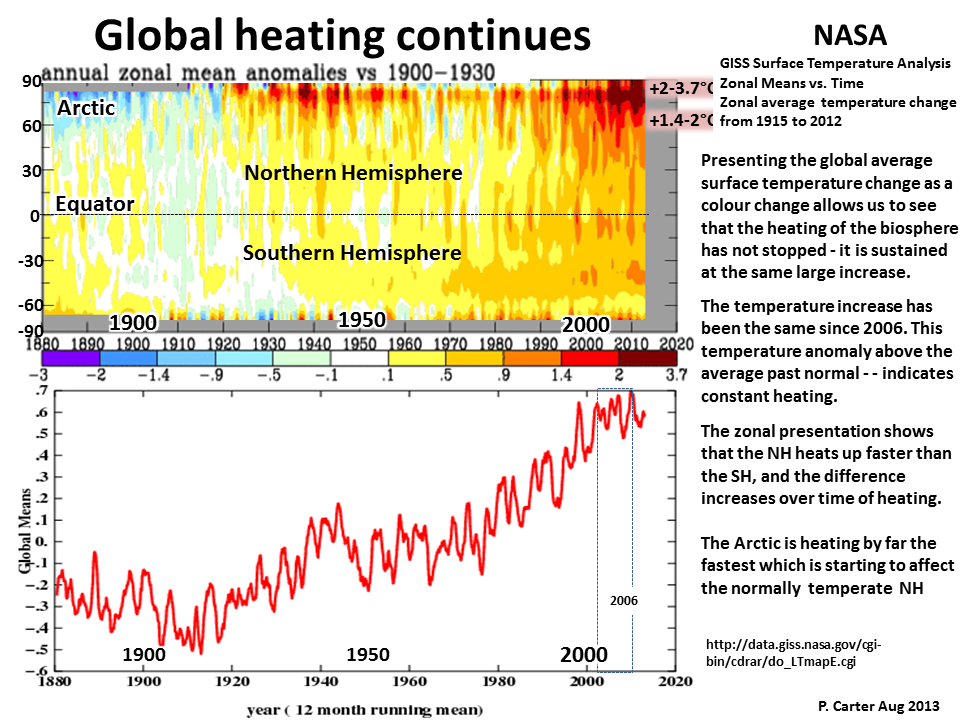
NASA provides key indicators on its climate change page namely global land-ocean surface temperature change, atmospheric CO2, Arctic sea ice, and land ice.
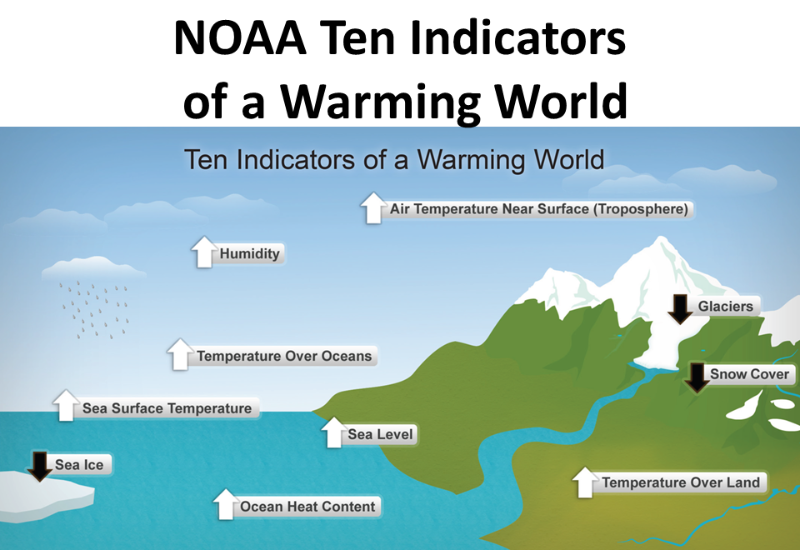
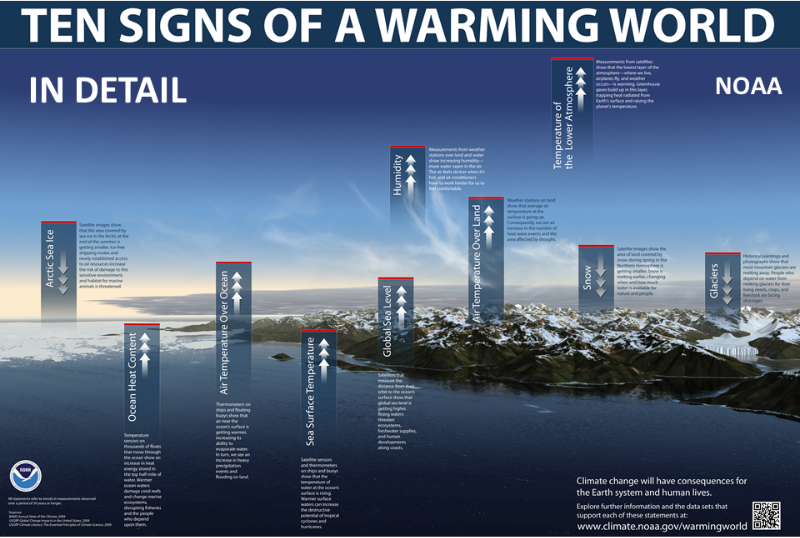
NOAA 10 warming world indicators
NOAA provides 10 indicators of planetary warming indicators on a slick interactive page.
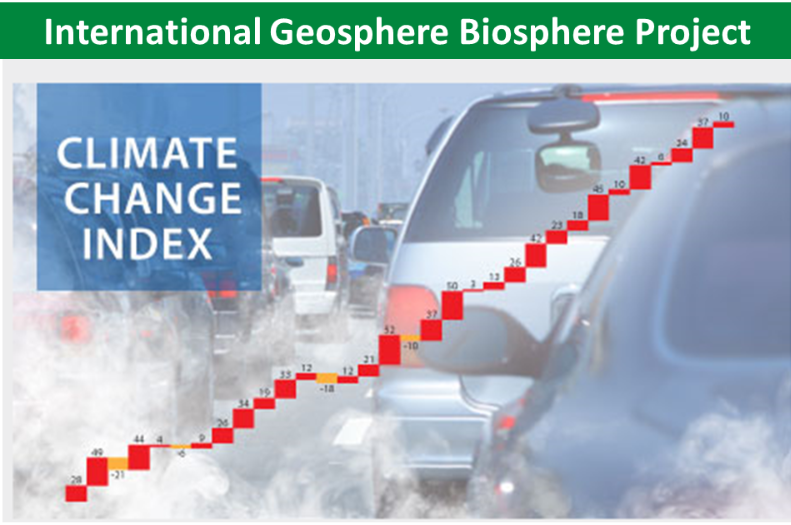
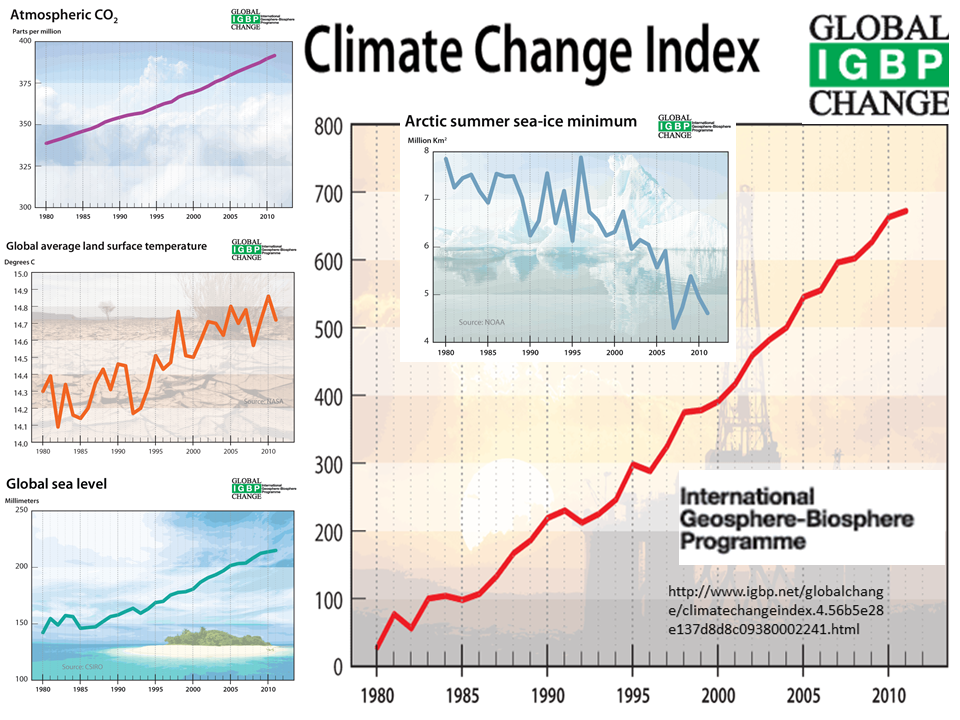
International Geosphere Biosphere Climate Change Index
IGBP provides 4 indicators combined as a very good visual single global climate change index.
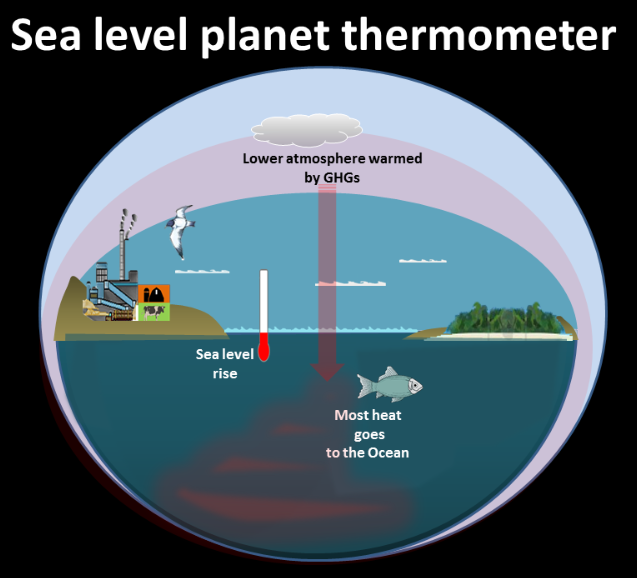
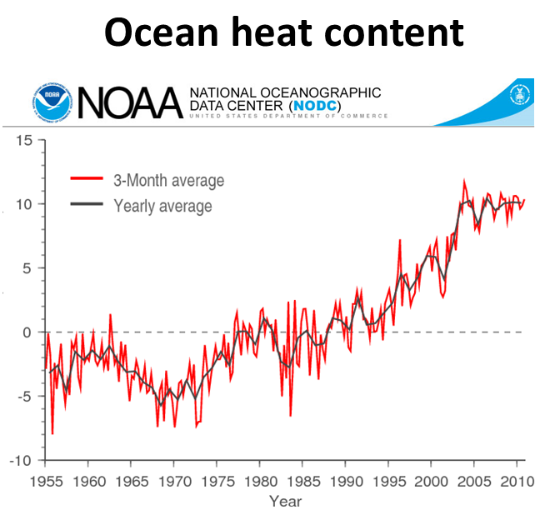
Ocean heating
Over 90% of the GHG heat that has been added to the lower atmosphere has gone into ocean warming so most of the climate system extra heat is in the oceans. NOAA measures the change from ARGO floats distributed round the world's oceans.
It shows the same post 2006 stall as surface temperature.
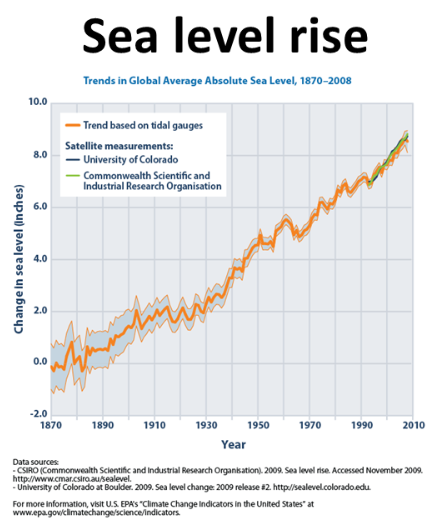
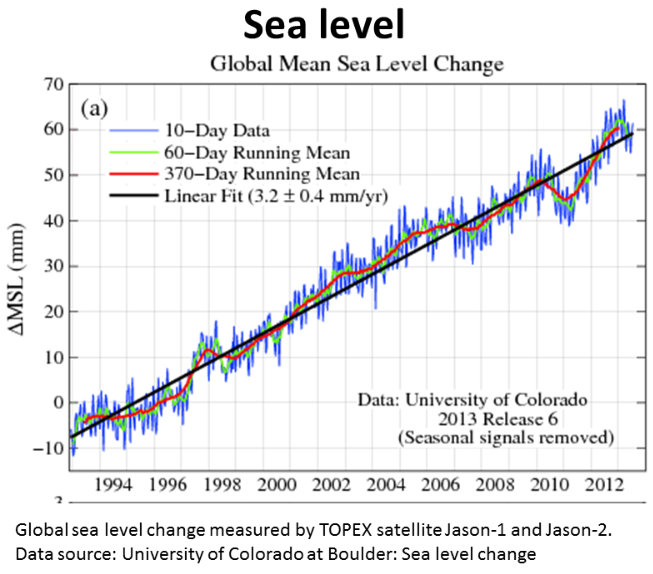
Sea level rise
In fact sea level rise alone is an excellent indicator that proves planetary heating, being mainly the result of direct thermal expansion of water and melting of land ice as contributing almost as much to the sea level rise. In fact sea level rise is like the planet's thermometer.
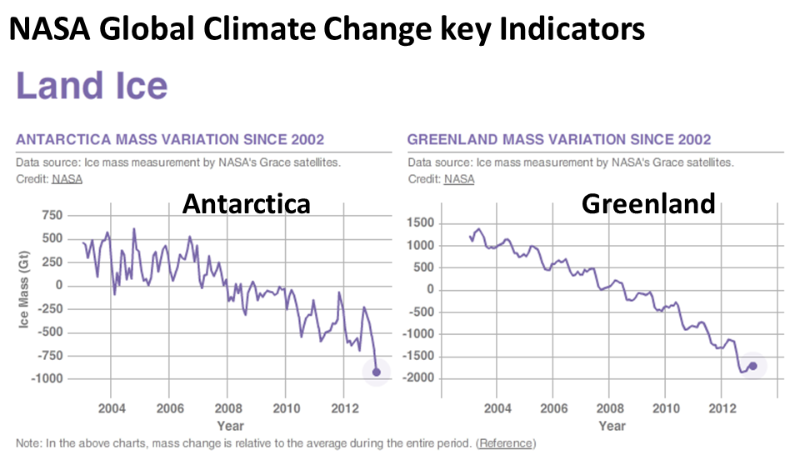
Melting land ice
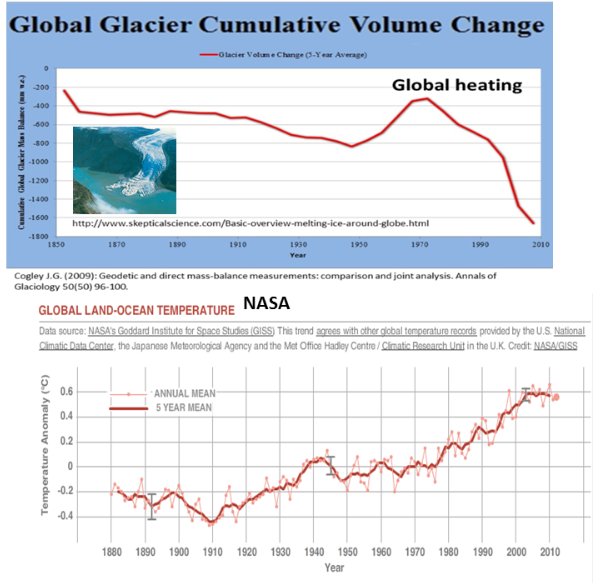
The rate of melting of planetary land ice is measured from satellites and directly from glaciers.
The global glacier melt rates precisely matches with the surface temperature swings of 1940 to 1960.
As it takes an enormous amount of heat energy to melt all the ice being lost this proves an enormous amount of ongoing planetary heating.
The continent of Antarctica (left chart) has been losing more than 100 cubic kilometers (24 cubic miles) of ice per year since 2002.(NASA)
Global warming does not tell us the amount of heat in the climate system, which at least doubles the global warming.
For climate policy and planning we need to know the climate change that we are committed to in the future which is the locked in warming.
Today's global warming alone is a dangerous guide for policy making.
If we followed atmospheric GHG pollution as the problem we would be better informed.
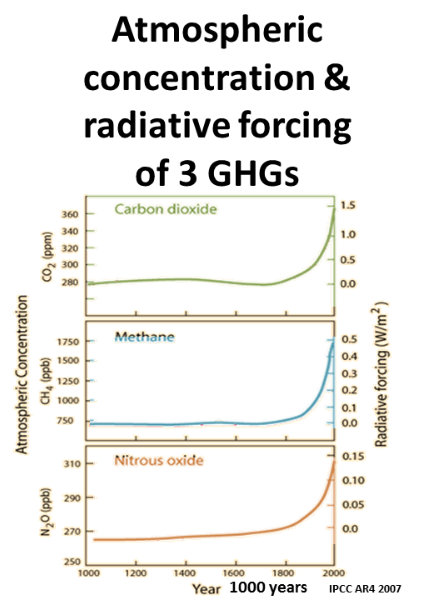
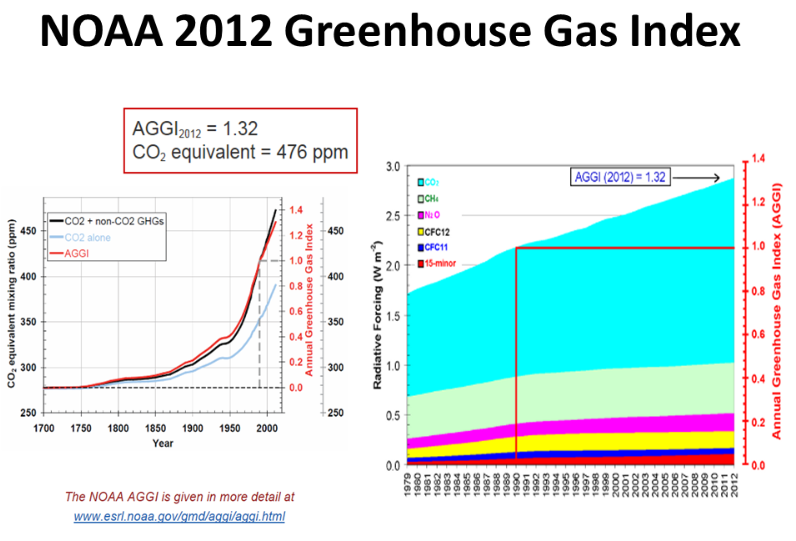
GHG Radiative Forcing
The radiative forcing of the three main GHGs which is the heating of the entire climate system by atmospheric pollution is a simple single indicator to be following, and it correlates directly with the atmospheric concentrations of the greenhouse gases.
NOAA annual GHG Index
The NOAA makes it easy for us by providing the annual GHG Index, which is calculated from the atmospheric concentration and so radiative forcing of the 3 main GHGs.
This is the single best indicator and should be used in climate change assessment and policy making and as more policy relevant that the global warming, which of course will still be followed.
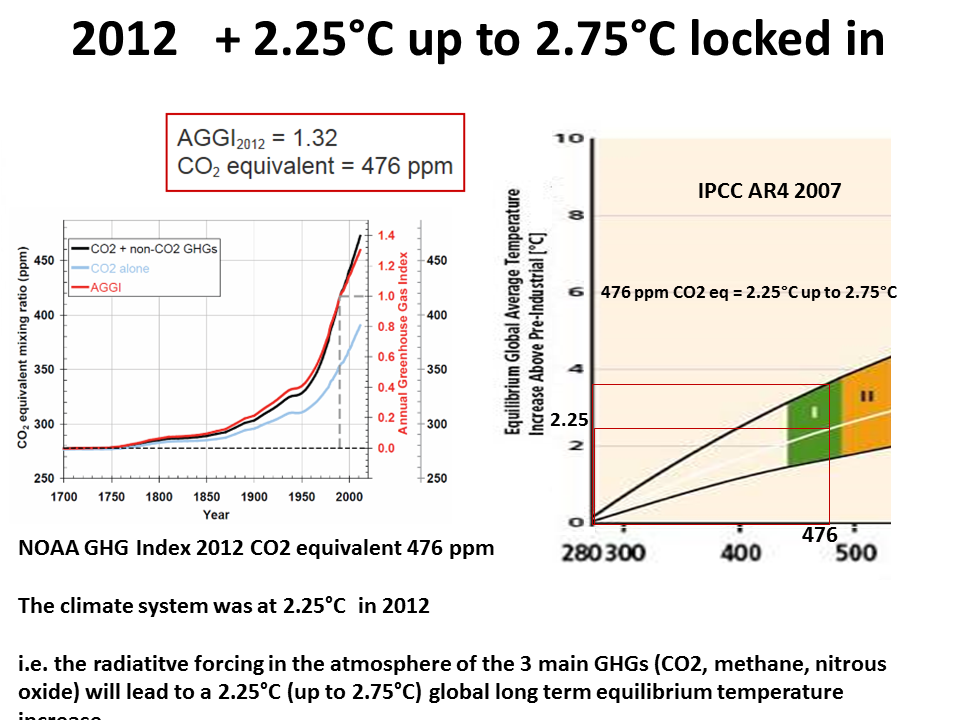
What the GHG index tells would surprise many people. In 2012 the GHG Index was based on an atmospheric CO2 Equivalent of 476 ppm. The CO2 equivalent is used (not the CO2 ppm alone) because this includes the the radiative forcing of methane and nitrous oxide.
This means, using the IPCC date for CO2 equivalent and equilibrium warming that a warming of 2.25C was locked in as of 2012. If all emissions has suddenly stopped in 2012 warming would slow but continue to 2.25C.
is defined as the global average increase in temperature near the Earths surface (EPA).
NOAA calls it the land-sea temperature increase as the vast ocean warms much slower that the land
As such it is only one indication of the heat energy added to the climate system by way of the lower atmosphere warming by an increase in atmospheric GHGs.
It is far from the best indicator to use as guide to the effects of atmospheric GHG pollution and policy making.
James Lovelock always used the term 'global heating' which is a better alternative.
A very early reference is from 1972 Stockholm UN Population and Environment conference that used 'atmospheric heating' which is accurate.
NASA Key Indicators
NASA provides key indicators on its climate change page namely global land-ocean surface temperature change, atmospheric CO2, Arctic sea ice, and land ice.
NOAA 10 warming world indicators
NOAA provides 10 indicators of planetary warming indicators on a slick interactive page.
International Geosphere Biosphere Climate Change Index
IGBP provides 4 indicators combined as a very good visual single global climate change index.
Ocean heating
Over 90% of the GHG heat that has been added to the lower atmosphere has gone into ocean warming so most of the climate system extra heat is in the oceans. NOAA measures the change from ARGO floats distributed round the world's oceans.
It shows the same post 2006 stall as surface temperature.
Sea level rise
In fact sea level rise alone is an excellent indicator that proves planetary heating, being mainly the result of direct thermal expansion of water and melting of land ice as contributing almost as much to the sea level rise. In fact sea level rise is like the planet's thermometer.
Melting land ice
The rate of melting of planetary land ice is measured from satellites and directly from glaciers.
The global glacier melt rates precisely matches with the surface temperature swings of 1940 to 1960.
As it takes an enormous amount of heat energy to melt all the ice being lost this proves an enormous amount of ongoing planetary heating.
The continent of Antarctica (left chart) has been losing more than 100 cubic kilometers (24 cubic miles) of ice per year since 2002.(NASA)
Global warming does not tell us the amount of heat in the climate system, which at least doubles the global warming.
For climate policy and planning we need to know the climate change that we are committed to in the future which is the locked in warming.
Today's global warming alone is a dangerous guide for policy making.
If we followed atmospheric GHG pollution as the problem we would be better informed.
GHG Radiative Forcing
The radiative forcing of the three main GHGs which is the heating of the entire climate system by atmospheric pollution is a simple single indicator to be following, and it correlates directly with the atmospheric concentrations of the greenhouse gases.
NOAA annual GHG Index
The NOAA makes it easy for us by providing the annual GHG Index, which is calculated from the atmospheric concentration and so radiative forcing of the 3 main GHGs.
This is the single best indicator and should be used in climate change assessment and policy making and as more policy relevant that the global warming, which of course will still be followed.
What the GHG index tells would surprise many people. In 2012 the GHG Index was based on an atmospheric CO2 Equivalent of 476 ppm. The CO2 equivalent is used (not the CO2 ppm alone) because this includes the the radiative forcing of methane and nitrous oxide.
This means, using the IPCC date for CO2 equivalent and equilibrium warming that a warming of 2.25C was locked in as of 2012. If all emissions has suddenly stopped in 2012 warming would slow but continue to 2.25C.
The 2014 IPCC AR5 reports that today's atmospheric GHGs commit us to a warming of 2.0C.

CLIMATE EMERGENCY INSTITUTE
The health and human rights approach to climate change
The health and human rights approach to climate change