Atmospheric Greenhouse Gases
20,000 years
Current atmospheric GHG levels (State of Our Climate )
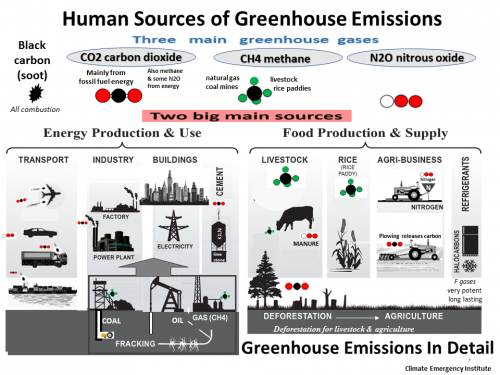
We refer to greenhouse emissions here because recently black carbon(BC)/
soot particles (aerosol) has been found to be second only to CO2 in global warming contribution. The largest source is burning forests, then burning fossil fuels particularly diesel and burning wood in wood-stoves and open cooking in much of the world.
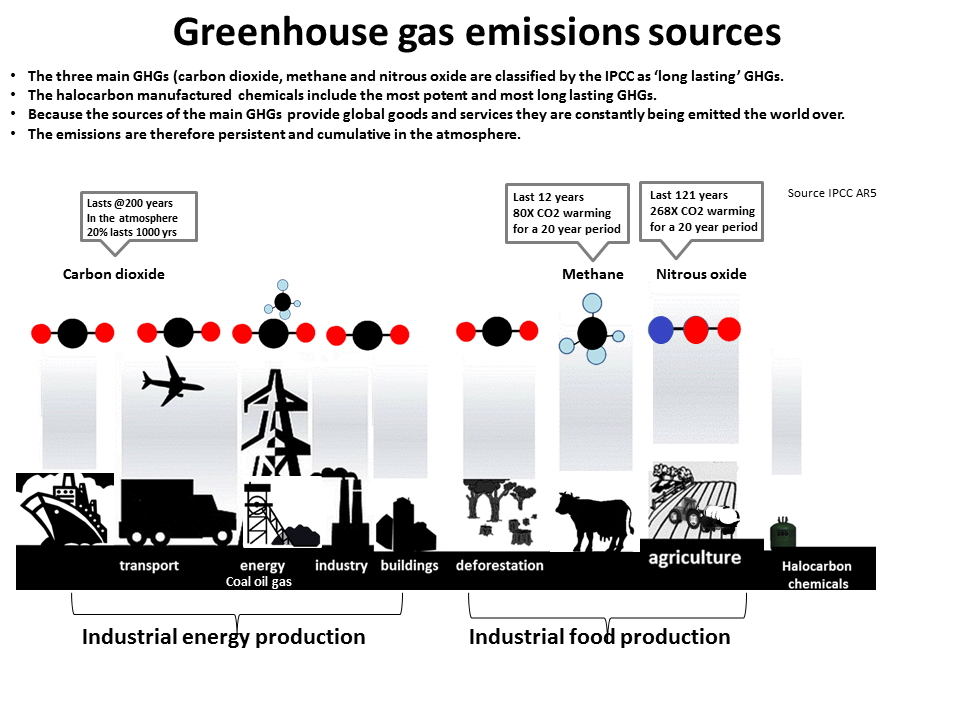
The Guardian (2011) has published a thorough breakdown of GHG emissions by sources
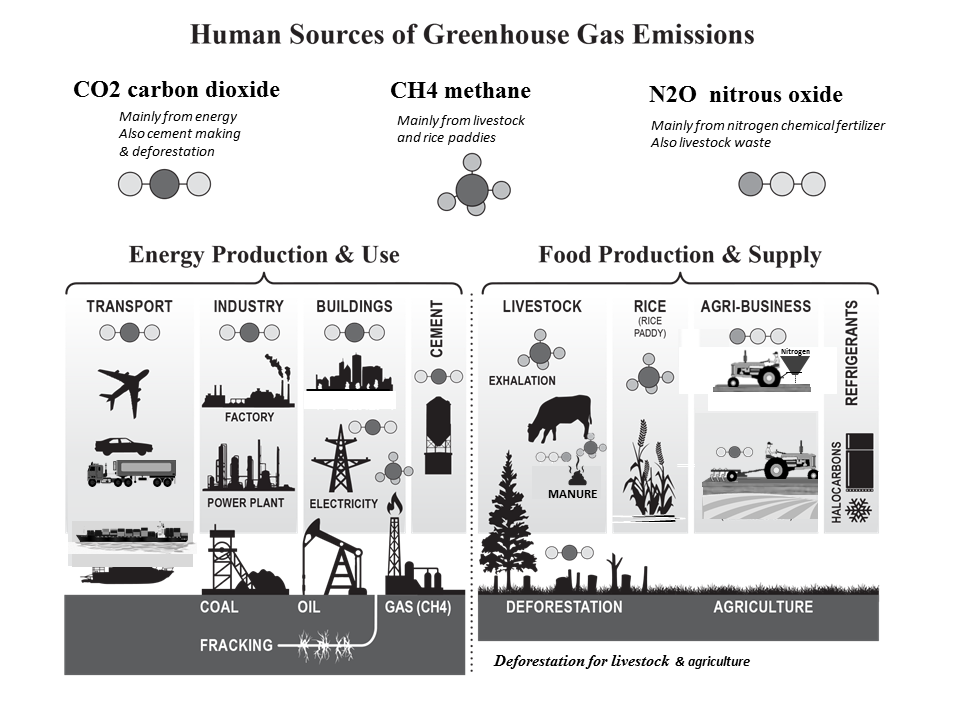
Industrial fossil fuel energy production and industrial food production (30-40%) are the two big sources of emissions.
Emitting GHGs at all cause is catastrophically dangerous because
soot particles (aerosol) has been found to be second only to CO2 in global warming contribution. The largest source is burning forests, then burning fossil fuels particularly diesel and burning wood in wood-stoves and open cooking in much of the world.
The Guardian (2011) has published a thorough breakdown of GHG emissions by sources
Industrial fossil fuel energy production and industrial food production (30-40%) are the two big sources of emissions.
Emitting GHGs at all cause is catastrophically dangerous because
of the extremely long atmospheric lifetime of carbon dioxide (and nitrous oxide) and chain reactions of interacting impacts and feedbacks
The fossil fuel industry is actually a source of all GHG emissions
The fossil fuel industry is actually a source of all GHG emissions
(varying extents), with the exception of halocarbons.
It is also the big source of health damaging air pollution. Coal combustion is a big source of health damaging mercury and heavy metals.
Natural gas (mainly methane CH4) is no better than coal. Though burning natural natural gas emits about half the CO2 as coal, fugitive (leaks) of methane (80X more powerful as CO2) makes natural gas almost as bad as coal (2018 research).
Atmospheric GHG concentration directly correlates with lower atmospheric radiative forcing. The increase in radiative forcing is the increase in the total heat in the climate system.
This is a far more accurate indicator of warming because it includes future committed global average temperature increase as well as today's temperature increase.
The main GHGs that naturally control ice ages alternating with warm periods, and are emitted by us - are carbon dioxide (CO2), methane (CH4) and nitrous oxide (N2O). They are classified by the IPCC as 'long lasting' atmospheric GHGs, lasting from about a decade (CH4) to over a century (CO2 & N2O).
Nitrous oxide is also now the top stratospheric ozone depleter.
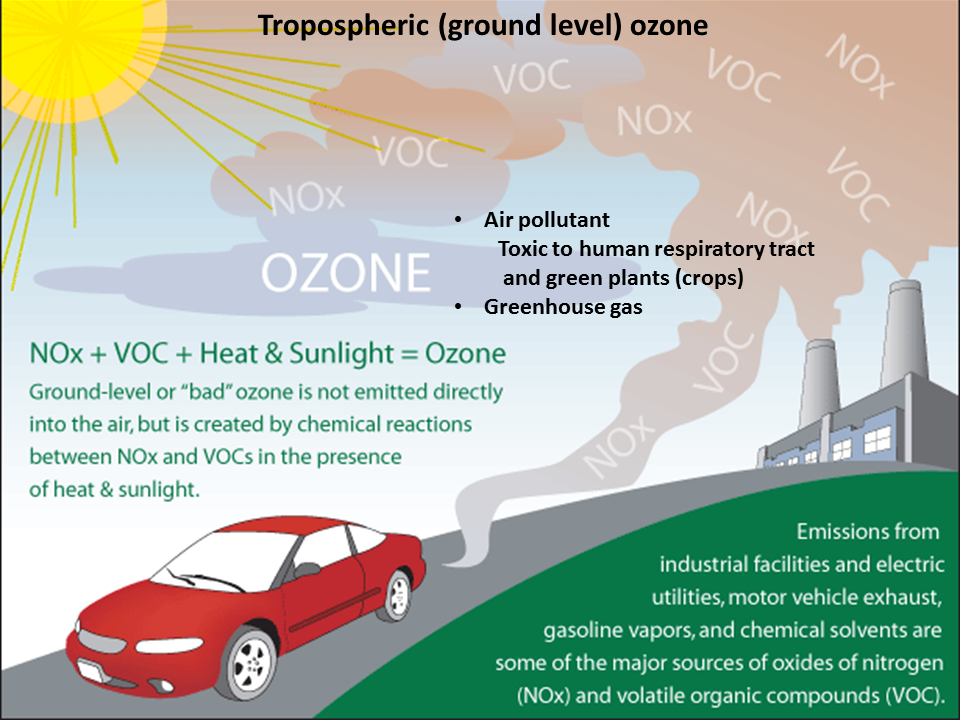
Tropospheric ozone ((ground level, or surface) is a short lived greenhouse gas and a well known toxic air pollutant caused by fossil fuel combustion.
Also CFCs and HCFCs are artifical chemicals used in industry.
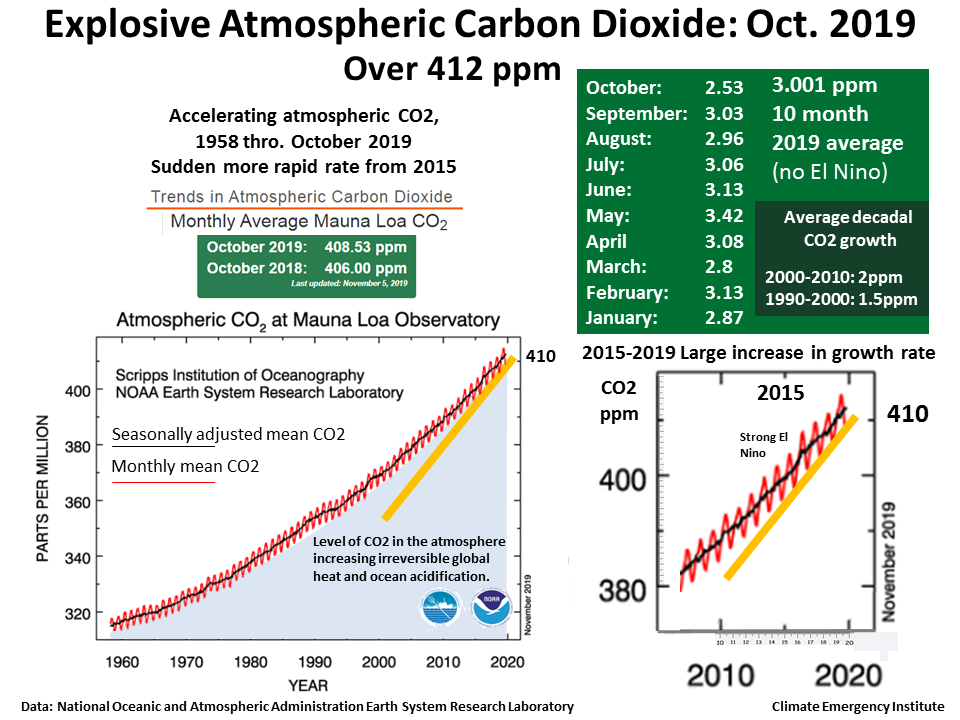
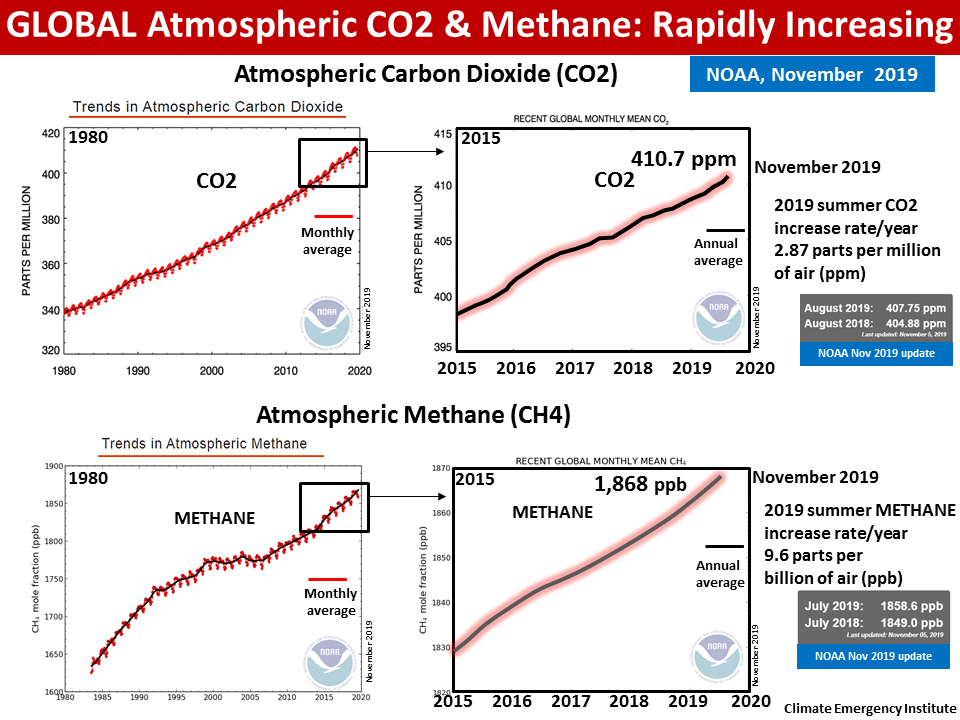
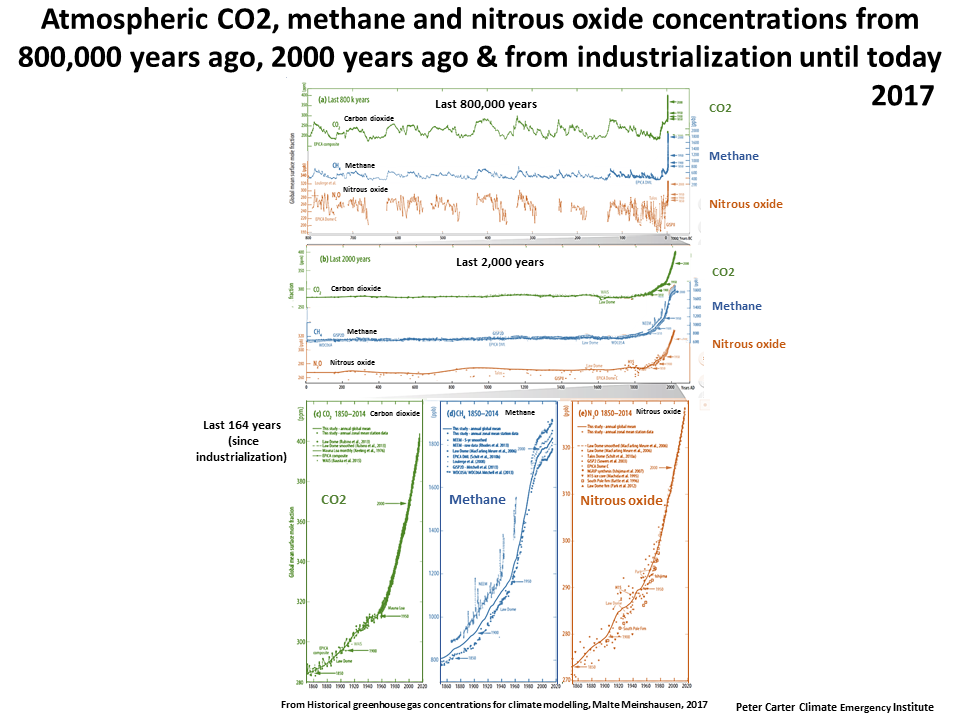
Atmospheric CO2 has increased 40% since industrialization.
Methane has increased by 150%.
Nitrous oxide has increased by 20%.
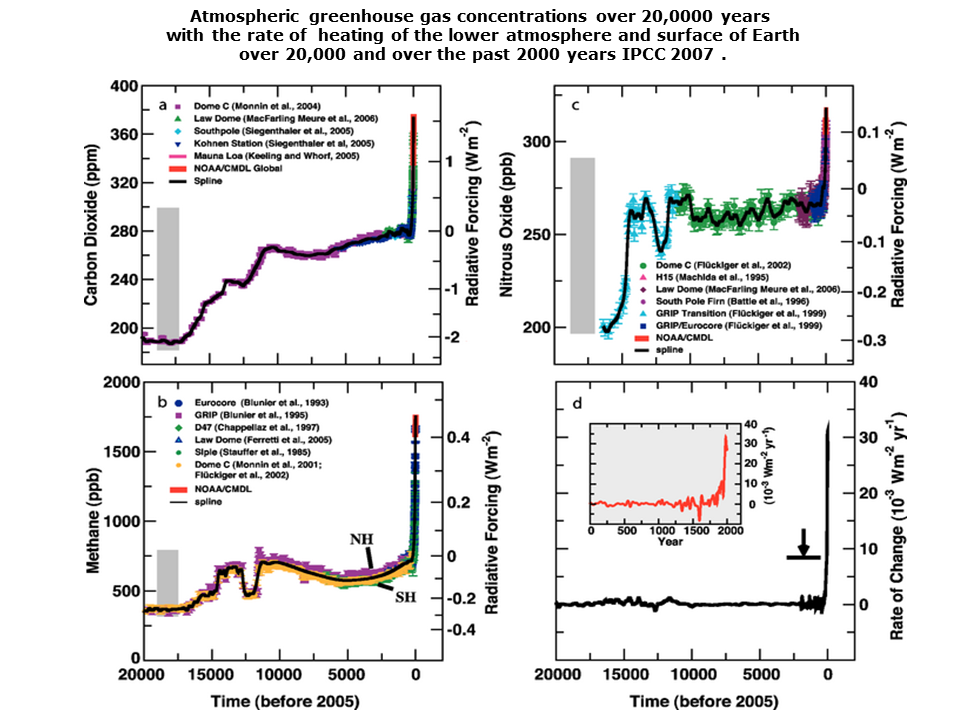
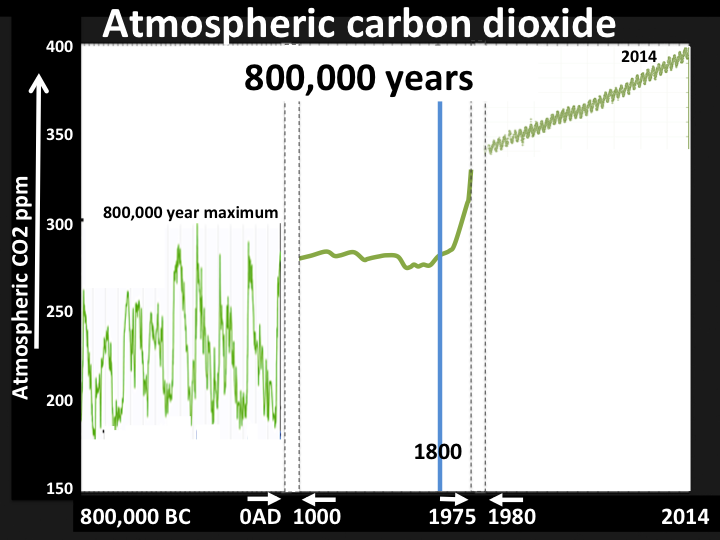
GHG ice core data goes back 800,000 years. Atmospheric CO2 is nearly 30% higher than its maximum level over the past 800,000 years, from ice core data.
Research on ocean sediment indicates this is the highest in 15 million years.
The rate of atmospheric CO2 increase in unprecedented.
Methane is over double its 800,000 limit.
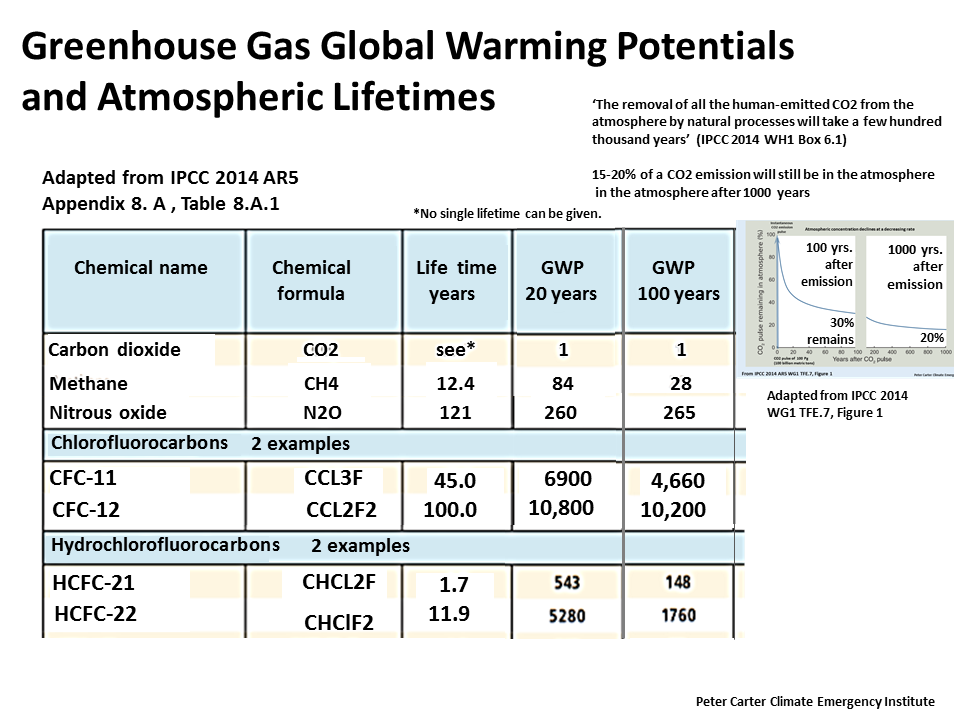
These three main GHGs have different atmospheric lifetimes and different global warming capacities (global warming potential GWP). The table below is from the IPCC AR4 2007.
Water vapour is the top GHG for warming contribution, because it is so abundant in the atmosphere. The other GHGs are classified as trace gases only existing in parts per million (CO2) or per billion (methane, nitrous oxide) of air. It is classified by the IPCC as a global warming feedback, its most important capacity, rather than a GHG emission. Warmer air/atmosphere holds more water vapour. This +ve (amplifying) feedback about doubles the warming of a GHG alone.
Atmospheric GHG concentration directly correlates with lower atmospheric radiative forcing. The increase in radiative forcing is the increase in the total heat in the climate system.
This is a far more accurate indicator of warming because it includes future committed global average temperature increase as well as today's temperature increase.
The main GHGs that naturally control ice ages alternating with warm periods, and are emitted by us - are carbon dioxide (CO2), methane (CH4) and nitrous oxide (N2O). They are classified by the IPCC as 'long lasting' atmospheric GHGs, lasting from about a decade (CH4) to over a century (CO2 & N2O).
Nitrous oxide is also now the top stratospheric ozone depleter.
Tropospheric ozone ((ground level, or surface) is a short lived greenhouse gas and a well known toxic air pollutant caused by fossil fuel combustion.
Also CFCs and HCFCs are artifical chemicals used in industry.
Atmospheric CO2 has increased 40% since industrialization.
Methane has increased by 150%.
Nitrous oxide has increased by 20%.
GHG ice core data goes back 800,000 years. Atmospheric CO2 is nearly 30% higher than its maximum level over the past 800,000 years, from ice core data.
Research on ocean sediment indicates this is the highest in 15 million years.
The rate of atmospheric CO2 increase in unprecedented.
Methane is over double its 800,000 limit.
These three main GHGs have different atmospheric lifetimes and different global warming capacities (global warming potential GWP). The table below is from the IPCC AR4 2007.
Water vapour is the top GHG for warming contribution, because it is so abundant in the atmosphere. The other GHGs are classified as trace gases only existing in parts per million (CO2) or per billion (methane, nitrous oxide) of air. It is classified by the IPCC as a global warming feedback, its most important capacity, rather than a GHG emission. Warmer air/atmosphere holds more water vapour. This +ve (amplifying) feedback about doubles the warming of a GHG alone.
CO2. Of the GHG emissions CO2 has contributed more than 60%. Bcause Because it is a very long atmospheric lifetime CO2 emissions are highly persistent and therefore cumulative in the atmosphere. The IPCC gives no set metric on CO2 for atmospheric lifetime. The CDIAC assigns 100-300 years to CO2, but the big thing is that 20-40% of CO2 emissions last for 1000 years (IPCC AR5). In fact the lifetime is over 100,000 years. CO2 is also special for causing ocean acidification. The main sources are fossil fuel energy, deforestation and cement manufacturing (heating limestone).
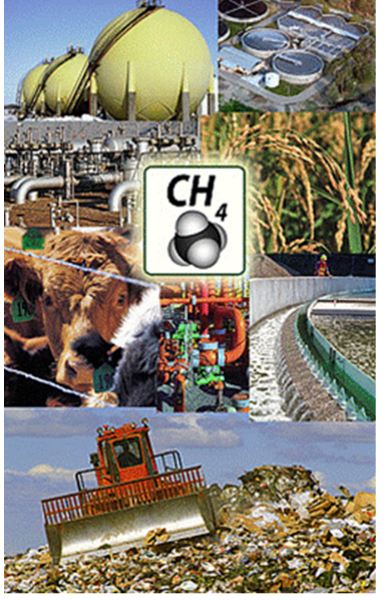
CH4. Methane is classified by the IPCC as a long lived GHG. Methane's warming contribution has been over 50% of CO2's . Methane lasts in the atmosphere 12 years which that means methane emissions exert a warming 100 times that of CO2 over its lifetime. In addition methane disappears because it is oxidized to other GHGs - including water vapour, and CO2 (that is not accounted in the methane GWP. Main sources are livestock (ruminants exhale methane), natural gas industry (esp fracking), coal mining, natural wetlands, and rice paddies (wetlands).
A special feature of methane is the more of it there is in the atmosphere the longer methane will last in the atmosphere
Methane feedback. The big thing about methane now is that we are into methane feedback.
Atmospheric methane increase levelled off at 2000, but since 2007 has been on a sustained fast increase that the scientists say is due to methane feedback emissions from the warming planet. The sources are thought to be warming subarctic and tropical peatlands.
N20. Nitrous oxide contributes the least of these 3 GHGs to global warming, but is increasing fastest. It has both an extreme long life time (114 years) and high GWP (298 over 100 years). The main sources are nitrogen chemical fertilizer (made from natural gas), livestock feed production ( same reason), livestock waste, and sewage.
Nitrous oxide is doubly important now because it is the main cause of depletion affecting the stratospheric ozone UV protective layer.
Tropospheric O3. Toxic ground level ozone (distinct from stratospheric ozone that is the UV radiation shield) is a short lasting GHG. It is formed by a chemical reaction between oxides of nitrogen and volatile organic compounds (both from fossil fuels) which is catalyzed by solar warmth. It therefore increases with global warming. As well as being toxic to human health, it is toxic to green plants, so as its concentration increases with warming the capacity of green plants to fix carbon from CO2 will decrease, a +ve amplifying feedback.

Recent Research
by date
30 Oct 2019 Two-million-year-old snapshots of
atmospheric gases from Antarctic ice (CO2 methane lower)
atmospheric gases from Antarctic ice (CO2 methane lower)
March 2019 Very Strong Atmospheric Methane Growth
Dec 2018 PBL Trends in global CO2 and total greenhouse gas emissions: 2018 report
2018 Gas Assessment of methane emissions from the U.S. oil and gas
supply chain
April 2016 PNAS Analysis health and climate change cobenefits of dietary change/food production= more than a quarter of GHG emissions
supply chain
April 2016 PNAS Analysis health and climate change cobenefits of dietary change/food production= more than a quarter of GHG emissions
May 2015 R. Rhodes Paleoclimate. Enhanced tropical methane production in response to iceberg discharge in the North Atlantic.
2009 Worldwatch All live
stock for meat 51% global GHG emissions
2006 FAO Livestock's Long Shadow Livestock 18% of global GHG emissions
May 2015 R. Rhodes Paleoclimate. Enhanced tropical methane production in response to iceberg discharge in the North Atlantic.
2009 Worldwatch All live
stock for meat 51% global GHG emissions
2006 FAO Livestock's Long Shadow Livestock 18% of global GHG emissions
Climate Emergency Institute
EPA Atmospheric GHGs
800,000 yrs agoand 1950-2015
800,000 yrs agoand 1950-2015
The WMO publishes its annual Greenhouse Gas Bulletin.
VIDEO The carbon cycle and global warming
Who Owns Fossil Fuels Report 2018