Antarctic Research Details Ice Melt Below Massive Glacier
Why Sea Level Rise is Occurring Faster than Projected
Warm Ocean Water is Primary Driver for Antarctic Ice Shelf Loss
___________________
Latest Research
Why Sea Level Rise is Occurring Faster than Projected
Warm Ocean Water is Primary Driver for Antarctic Ice Shelf Loss
___________________
Latest Research
by date
28 Oct 2020 Antarctic Ice Sheet is primed to pass irreversible climate thresholds: Researchers
28 Oct 2020 Antarctic Ice Sheet is primed to pass irreversible climate thresholds: Researchers
26 July 2019 Direct observations of submarine melt .. . at a tidewater glacier. Submarine melting 100X faster with implications sea level
14 Jan 2019 Accelerating melt -Antarctica losing six times more ice mass annually now than 40 years ago
5 Dec 2018, L Trusel, Greenland is losing ice at fastest rate in 350 years,
___________________
26 June 2017 The increasing rate of global mean sea-level rise during 1993–2014
Sea level rise increased from about 50% in 1993 to 70% in 2014 with the largest, and statistically significant, increase coming from the contribution from the Greenland ice sheet, which is less than 5% of the GMSL rate during 1993 but more than 25% during 2014.
Nov 2015 Carbon choices determine US cities committed to futures below sea level
October 2014 Changing Antarctic waters could trigger steep rise in sea levels; Stratification of ocean temperatures could lead to rapid collapse of glaciers and ice shelves. Antarctic contribution to meltwater pulse 1A from reduced Southern Ocean overturning. Nature Communications, 2014; 5: 5107 DOI: 10.1038/ncomms6107
September 2014 Sea-level variability over five glacial cycles. Nature Communications 5, Article number: 5076, Sept 2014; doi:10.1038/ncomms6076
August 2014 Shifting perspectives on coastal impacts and adaptation. Managing coasts under threat from climate change and sea-level rise [Nature Climate Change, 2014; 4 (9): 752 DOI: 10.1038/nclimate2344]
July 2014 Has Antarctic sea ice expansion been overestimated? New research suggests that Antarctic sea ice may not be expanding as fast as previously thought. [The Cryosphere, 8, 1289-1296, DOI:10.5194/tc-8-1289-2014, 2014]
July 2014 Changing Antarctic winds create new sea level threat. New research shows projected changes in the winds circling the Antarctic may accelerate global sea level rise [Geophysical Research Letters, 2014; DOI: 10.1002/2014GL060613]
June 2014 Study links Greenland ice sheet collapse, sea level rise 400,000 years ago; [Nature, 2014; DOI: 10.1038/nature13456]
May 2014 Antarctic ice-sheet less stable than previously assumed [Nature, 2014; DOI: 10.1038/nature13397]
May 2014 Greenland will be far greater contributor to sea rise than expected [Nature Geoscience, 2014; DOI: 10.1038/ngeo2167]
May 2014 West Antarctic Glaciers in Irreversible Decline
May 2014 Climate change and forest fires synergistically drive widespread melt events of the Greenland Ice Sheet [PNAS 2014; doi/10.1073/pnas.1405397111]
Sea Level Rise
Changing Antarctic waters could trigger steep rise in sea levels
Thu, 13th November, 2014
Stratification of ocean temperatures could lead to rapid collapse of glaciers and ice shelves
Source: University of New South Wales
Posted by Jenny Griffin
Current changes in the ocean around Antarctica are disturbingly close to conditions 14,000 years ago that new research shows may have led to the rapid melting of Antarctic ice and an abrupt 3-4 metre rise in global sea level.
The research published in Nature Communications found that in the past, when ocean temperatures around Antarctica became more layered - with a warm layer of water below a cold surface layer - ice sheets and glaciers melted much faster than when the cool and warm layers mixed more easily.
This defined layering of temperatures is exactly what is happening now around the Antarctic.
"The reason for the layering is that global warming in parts of Antarctica is causing land-based ice to melt, adding massive amounts of freshwater to the ocean surface," said ARC Centre of Excellence for Climate System Science researcher Prof Matthew England an author of the paper.
"At the same time as the surface is cooling, the deeper ocean is warming, which has already accelerated the decline of glaciers on Pine Island and Totten. It appears global warming is replicating conditions that, in the past, triggered significant shifts in the stability of the Antarctic ice sheet."
The modelling shows the last time this occurred, 14,000 years ago, the Antarctic alone contributed 3-4 metres to global sea levels in just a few centuries.
"Our model simulations provide a new mechanism that reconciles geological evidence of past global sea level rise," said researcher UNSW ARC Future Fellow Dr Chris Fogwill.
"The results demonstrate that while Antarctic ice sheets are remote, they may play a far bigger role in driving past and importantly future sea level rise than we previously suspected."
The accelerating melting of land ice into the sea makes the surface of the ocean around Antarctica colder, less salty and more easily frozen, leading to extensive sea ice in some areas. It is one of the reasons ascribed to the increasing trend in sea ice around Antarctica.
To get their results the researchers used sophisticated ice sheet and climate models and verified their results with independent geological observations from the oceans off Antarctica. The geological data clearly showed that when the waters around the Antarctic became more stratified, the ice sheets melted much more quickly.
"The big question is whether the ice sheet will react to these changing ocean conditions as rapidly as it did 14,000 years ago," said lead author Dr Nick Golledge, a senior research fellow at Victoria's Antarctic Research Centre.
"With 10 per cent of the world's population, or 700 million people, living less than 10 metres above present sea level, an additional three metres of sea level rise from the Antarctic alone will have a profound impact on us all."
Journal Reference:
N. R. Golledge, L. Menviel, L. Carter, C. J. Fogwill, M. H. England, G. Cortese, R. H. Levy. Antarctic contribution to meltwater pulse 1A from reduced Southern Ocean overturning. Nature Communications, 2014; 5: 5107 DOI: 10.1038/ncomms6107
Study finds global sea levels rose up to 5 meters per century at the end of the last 5 ice ages
Thu, 13th November, 2014
Source: University of Southampton
Posted by Jenny Griffin
Land-ice decay at the end of the last five ice-ages caused global sea-levels to rise at rates of up to 5.5 metres per century, according to a new study.
An international team of researchers developed a 500,000-year record of sea-level variability, to provide the first account of how quickly sea-level changed during the last five ice-age cycles.
The results, published in the latest issue of Nature Communications, also found that more than 100 smaller events of sea-level rise took place in between the five major events.
Dr Katharine Grant, from the Australian National University (ANU), Canberra, who led the study, says: "The really fast rates of sea-level rise typically seem to have happened at the end of periods with exceptionally large ice sheets, when there was two or more times more ice on the Earth than today.
"Time periods with less than twice the modern global ice volume show almost no indications of sea-level rise faster than about 2 metres per century. Those with close to the modern amount of ice on Earth, show rates of up to 1 to 1.5 metres per century."
Co-author Professor Eelco Rohling, of both the University of Southampton and ANU, explains that the study also sheds light on the timescales of change. He says: "For the first time, we have data from a sufficiently large set of events to systematically study the timescale over which ice-sheet responses developed from initial change to maximum retreat."
"This happened within 400 years for 68 per cent of all 120 cases considered, and within 1100 years for 95 per cent. In other words, once triggered, ice-sheet reduction (and therefore sea-level rise) kept accelerating relentlessly over periods of many centuries."
Professor Rohling speculates that there may be an important lesson for our future: "Man-made warming spans 150 years already and studies have documented clear increases in mass-loss from the Antarctic and Greenland ice sheets. Once under way, this response may be irreversible for many centuries to come."
The team reconstructed sea-levels using data from sediment cores from the Red Sea, an area that is very sensitive to sea-level changes because it's only natural connection with the open (Indian) ocean is through the very shallow (137 metre) Bab-el-Mandab Strait. These sediment samples record wind-blown dust variations, which the team linked to a well-dated climate record from Chinese stalagmites. Due to a common process, both dust and stalagmite records show a pronounced change at the end of each ice age, which allowed the team to date the sea-level record in detail.
The researchers emphasise that their values for sea-level change are 500-year averages, so brief pulses of faster change cannot be excluded.
Journal Reference:
KM Grant, EJ Rohling, C Bronk Ramsey, H Cheng, RL Edwards, F Florindo, D Heslop, F Marra, AP Roberts, ME Tamisiea & F Williams. Sea-level variability over five glacial cycles. Nature Communications 5, Article number: 5076, Sept 2014; doi:10.1038/ncomms6076
Managing coasts under threat from climate change and sea-level rise
Wed, 12th November, 2014
Source: University of Southampton
Posted by Jenny Griffin
Coastal regions under threat from climate change and sea-level rise need to tackle the more immediate threats of human-led and other non-climatic changes, according to a team of international scientists.
The team of 27 scientists from five continents, led by Dr Sally Brown at the University of Southampton, reviewed 24 years of Intergovernmental Panel on Climate Change (IPCC) assessments (the fifth and latest set being published in 2013 and 2014). They focused on climate change and sea-level rise impacts in the coastal zone, and examined ways of how to better manage and cope with climate change.
They found that to better understand climate change and its impacts, scientists need to adopt an integrated approach into how coasts are changing. This involves recognising other causes of change, such as population growth, economic development and changes in biodiversity. Dr Brown emphasised that: "Over the last two and half decades, our scientific understanding of climate change and sea-level rise, and how it will affect coastal zones has greatly increased. We now recognise that we need to analyse all parts of our human and natural environments to understand how climate change will affect the world."
The scientists also acknowledged that long-term adaptation to climate change can greatly reduce impacts, but further research and evaluation is required to realise the potential of adaptation. "Many parts of the coast can, with forward planning, adapt to sea-level rise, but we need to better understand environments that will struggle to adapt, such as developing countries with large low-lying river deltas sensitive to salinisation, or coral reefs and particularly small, remote islands or poorer communities," said Dr Brown.
For example, in the Maldives, many small, remote low-lying islands are at risk from climate change and will struggle to adapt. But around the densely populated capital city and airport, adaptation has already occurred as land claim is a common practice in order to relive population pressure. Sea-level rise has already been considered into newly claimed land. Thus in decades to come, potential climate change impacts, such as flooding, will be reduced for this island, benefiting both the local population and economy.
Dr Jochen Hinkel from Global Climate Forum in Germany, who is a co-author of this paper and a Lead Author of the coastal chapter for the 2014 IPCC Assessment Report added: "The IPCC has done a great job in bringing together knowledge on climate change, sea-level rise and is potential impacts but now needs to complement this work with a solution-oriented perspective focusing on overcoming barriers to adaptation, mobilising resources, empowering people and discovering opportunities for strengthening coastal resilience in the context of both climate change as well as existing coastal challenges and other issues."
This new research, published as a commentary in Nature Climate Change, will help in the understanding of the impacts of climate change and how to reduce impacts via adaptation. Its multi-disciplinary approach could be useful if future IPCC assessment reports are commissioned.
Journal Reference:
Sally Brown, Robert J. Nicholls, Susan Hanson, Geoff Brundrit, John A. Dearing, Mark E. Dickson, Shari L. Gallop, Shu Gao, Ivan D. Haigh, Jochen Hinkel, José A. Jiménez, Richard J. T. Klein, Wolfgang Kron, Attila N. Lázár, Claudio Freitas Neves, Alice Newton, Charitha Pattiaratachi, Andres Payo, Kenneth Pye, AgustÃn Sánchez-Arcilla, Mark Siddall, Ali Shareef, Emma L. Tompkins, Athanasios T. Vafeidis, Barend van Maanen, Philip J. Ward, Colin D. Woodroffe. Shifting perspectives on coastal impacts and adaptation. Nature Climate Change, 2014; 4 (9): 752 DOI: 10.1038/nclimate2344
Antarctic sea-level rising faster than global rate
Wed, 12th November, 2014
Source: University of Southampton
Posted by Jenny Griffin
A new study of satellite data from the last 19 years reveals that fresh water from melting glaciers has caused the sea-level around the coast of Antarctica to rise by 2cm more than the global average of 6cm.
Researchers at the University of Southampton detected the rapid rise in sea-level by studying satellite scans of a region that spans more than a million square kilometres.
The melting of the Antarctic ice sheet and the thinning of floating ice shelves has contributed an excess of around 350 gigatonnes of freshwater to the surrounding ocean. This has led to a reduction in the salinity of the surrounding oceans that has been corroborated by ship-based studies of the water.
"Freshwater is less dense than salt water and so in regions where an excess of freshwater has accumulated we expect a localised rise in sea level," says Craig Rye, lead author of the paper that has been published in the journal Nature Geoscience.
In addition to satellite observations, the researchers also conducted computer simulations of the effect of melting glaciers on the Antarctic Ocean. The results of the simulation closely mirrored the real-world picture presented by the satellite data.
"The computer model supports our theory that the sea-level rise we see in our satellite data is almost entirely caused by freshening (a reduction in the salinity of the water) from the melting of the ice sheet and its fringing ice shelves," says Craig.
"The interaction between air, sea and ice in these seas is central to the stability of the Antarctic Ice Sheet and global sea levels, as well as other environmental processes, such as the generation of Antarctic bottom water, which cools and ventilates much of the global ocean abyss."
The research was carried out in close collaboration with researchers at the National Oceanography Centre and the British Antarctic Survey.
Journal Reference:
Craig Rye et al. Rapid sea-level rise along the Antarctic margins in response to increased glacial discharge. Nature Geoscience, 2014
Has Antarctic sea ice expansion been overestimated?
Tue, 11th November, 2014
Source: European Geosciences Union
Posted by Jenny Griffin
New research suggests that Antarctic sea ice may not be expanding as fast as previously thought. A team of scientists say much of the increase measured for Southern Hemisphere sea ice could be due to a processing error in the satellite data. The findings are published today in The Cryosphere, a journal of the European Geosciences Union (EGU).
Arctic sea ice is retreating at a dramatic rate. In contrast, satellite observations suggest that sea ice cover in the Antarctic is expanding � albeit at a moderate rate � and that sea ice extent has reached record highs in recent years. What�s causing Southern Hemisphere sea ice cover to increase in a warming world has puzzled scientists since the trend was first spotted. Now, a team of researchers has suggested that much of the measured expansion may be due to an error, not previously documented, in the way satellite data was processed.
�This implies that the Antarctic sea ice trends reported in the IPCC�s AR4 and AR5 [the 2007 and 2013 assessment reports from the Intergovernmental Panel on Climate Change] can�t both be correct: our findings show that the data used in one of the reports contains a significant error. But we have not yet been able to identify which one contains the error,� says lead-author Ian Eisenman of the Scripps Institution of Oceanography at University of California San Diego in the US.
Reflecting the scientific literature at the time, the AR4 reported that Antarctic sea ice cover remained more or less constant between 1979 and 2005. On the other hand, recent literature and the AR5 indicate that, between 1979 and 2012, Southern Hemisphere sea ice extent increased at a rate of about 16.5 thousand square kilometres per year. Scientists assumed the difference to be a result of adding several more years to the observational record.
�But when we looked at how the numbers reported for the trend had changed, and we looked at the time series of Antarctic sea ice extent, it didn�t look right,� says Eisenman, who set out to figure out what was wrong.
Scientists have used satellite data to measure sea ice cover for 35 years. But the data doesn�t come from a single instrument, orbiting on a single satellite throughout this period. Instead, researchers splice together observations from different instruments flown on a number of different satellites. They then use an algorithm � the most prevalent being the Bootstrap algorithm � and further processing to estimate sea ice cover from these data.
In the study published in The Cryosphere, Eisenman and collaborators compare two datasets for sea ice measurements. The most recent one, the source of AR5 conclusions, was generated using a version of Bootstrap updated in 2007, while the other, used in AR4 research, is the result of an older version of the algorithm.
The researchers found a difference between the two datasets related to a transition in satellite sensors in December 1991, and the way the data collected by the two instruments was calibrated. �It appears that one of the records did this calibration incorrectly, introducing a step-like change in December 1991 that was big enough to have a large influence on the long-term trend,� explains Eisenman.
�You�d think it would be easy to see which record has this spurious jump in December 1991, but there�s so much natural variability in the record � so much �noise� from one month to the next � that it�s not readily apparent which record contains the jump. When we subtract one record from the other, though, we remove most of this noise, and the step-like change in December 1991 becomes very clear.�
With the exception of the longer time period covered by the most recent dataset, the two records were thought to be nearly identical. But, by comparing the datasets and calculating Antarctic sea ice extent for each of them, the team found that there was a stark difference between the two records, with the current one giving larger rates of sea ice expansion than the old one in any given period.
If the error is in the current dataset, the results could contribute to an unexpected resolution for the Antarctic sea ice cover enigma.
*******
This research is presented in the paper �A spurious jump in the satellite record: has Antarctic sea ice expansion been overestimated?� published in the EGU open access journal The Cryosphere on 22 July 2014. The paper can be viewed online at: http://www.the-cryosphere.net/8/1289/2014/tc-8-1289-2014.html
Journal Reference:
Eisenman, I., Meier, W. N., and Norris, J. R.: A spurious jump in the satellite record: has Antarctic sea ice expansion been overestimated?, The Cryosphere, 8, 1289�1296, doi:10.5194/tc-8-1289-2014, 2014.
Antarctica could raise sea level faster than previously thought
Fri, 15th August, 2014
Source: Postdam Institute for Climate Impact Research
Posted by Jenny Griffin
The results reproduce Antarctica's recent contribution to sea level rise as observed by satellites in the last two decades and show that the ice continent could become the largest contributor to sea level rise much sooner than previously thought.
"If greenhouse gases continue to rise as before, ice discharge from Antarctica could raise the global ocean by an additional 1 to 37 centimeters in this century already," says lead author Anders Levermann. "Now this is a big range � which is exactly why we call it a risk: Science needs to be clear about the uncertainty, so that decision makers at the coast and in coastal megacities like Shanghai or New York can consider the potential implications in their planning processes," says Levermann.
Antarctica Currently Contributes Less Than 10 Percent to Global Sea Level Rise
The scientists analyzed how rising global mean temperatures resulted in a warming of the ocean around Antarctica, thus influencing the melting of the Antarctic ice shelves. While Antarctica currently contributes less than 10 percent to global sea level rise and is a minor contributor compared to the thermal expansion of the warming oceans and melting mountain glaciers, it is Greenland and especially the Antarctic ice sheets with their huge volume of ice that are expected to be the major contributors to future long-term sea level rise. The marine ice sheets in West Antarctica alone have the potential to elevate sea level by several meters - over several centuries.
According to the study, the computed projections for this century's sea level contribution are significantly higher than the latest IPCC projections on the upper end. Even in a scenario of strict climate policies limiting global warming in line with the 2°C target, the contribution of Antarctica to global sea level rise covers a range of 0 to 23 centimeters.
A Critical Input to Future Projections
"Rising sea level is widely regarded as a current and ongoing result of climate change that directly affects hundreds of millions of coastal dwellers around the world and indirectly affects billions more that share its financial costs," says co-author Robert Bindschadler from the NASA Goddard Space Flight Center. "This paper is a critical input to projections of possible future contributions of diminishing ice sheets to sea level by a rigorous consideration of uncertainty of not only the results of ice sheet models themselves but also the climate and ocean forcing driving the ice sheet models. Billions of Dollars, Euros, Yuan etc. are at stake and wise and cost-effective decision makers require this type of useful information from the scientific experts."
While the study signifies an important step towards a better understanding of Antarctica in a changing climate and its influence on sea level change within the 21st century, major modeling challenges still remain: Datasets of Antarctic bedrock topography, for instance, are still inadequate and some physical processes of interaction between ice and ocean cannot be sufficiently simulated yet.
Notably, the study's results are limited to this century only, while all 19 of the used comprehensive climate models indicate that the impacts of atmospheric warming on Antarctic ice shelf cavities will hit with a time delay of several decades. "Earlier research indicated that Antarctica would become important in the long term," says Levermann. "But pulling together all the evidence it seems that Antarctica could become the dominant cause of sea level rise much sooner."
Journal Reference:
Levermann, A., Winkelmann, R., Nowicki, S., Fastook, J.L., Frieler, K., Greve, R., Hellmer, H.H., Martin, M.A., Meinshausen, M., Mengel, M., Payne, A.J., Pollard, D., Sato, T., Timmermann, R., Wang, W.L., Bindschadler, R.A. (2014): Projecting Antarctic ice discharge using response functions from SeaRISE ice-sheet models. Earth System Dynamics, 5, 271-293 [DOI: 10.5194/esd-5-271-2014]
View the abstract or download the full paper at: http://www.earth-syst-dynam.net/5/271/2014/esd-5-271-2014.html
Human contribution to glacier mass loss on the increase
Fri, 15th August, 2014
Source: University of Innsbruck, Newsroom
Posted by Jenny Griffin
The ongoing global glacier retreat causes rising sea-levels, changing seasonal water availability and increasing geo-hazards. While melting glaciers have become emblematic of anthropogenic climate change, glacier extent responds very slowly to climate changes. "Typically, it takes glaciers decades or centuries to adjust to climate changes," says climate researcher Ben Marzeion from the Institute of Meteorology and Geophysics of the University of Innsbruck. The global retreat of glaciers observed today started around the middle of the 19th century at the end of the Little Ice Age. Glaciers respond both to naturally caused climate change of past centuries, for example solar variability, and to anthropogenic changes. The real extent of human contribution to glacier mass loss has been unclear until now.
Anthropogenic Causes
By using computer simulations of the climate, Ben Marzeion's team of researchers simulated glacier changes during the period of 1851 and 2010 in a model of glacier evolution. "The results of our models are consistent with observed glacier mass balances," says Marzeion. All glaciers in the world outside Antarctica were included in the study. The recently established Randolph Glacier Inventory (RGI), a complete inventory of all glaciers worldwide, enabled the scientists to run their model. "The RGI provides data of nearly all glaciers on the Earth in machine-readable format," explains Graham Cogley from Trent University in Canada, one of the coordinators of the RGI and co-author of the current study. Since the climate researchers are able to include different factors contributing to climate change in their model, they can differentiate between natural and anthropogenic influences on glacier mass loss. "While we keep factors such as solar variability and volcanic eruptions unchanged, we are able to modify land use changes and greenhouse gas emissions in our models," says Ben Marzeion, who sums up the study: "In our data we find unambiguous evidence of anthropogenic contribution to glacier mass loss."
Significant Increase in Recent Decades
The scientists show that only about one quarter (25 /-35 %) of the global glacier mass loss during the period of 1851 to 2010 is attributable to anthropogenic causes. However, during the last two decades between 1991 and 2010 the fraction increased to about two thirds (69 /-24%). "In the 19th and first half of 20th century we observed that glacier mass loss attributable to human activity is hardly noticeable but since then has steadily increased," says Ben Marzeion. The authors of the study also looked at model results on regional scales. However, the current observation data is insufficient in general to derive any clear results for specific regions, even though anthropogenic influence is detectable in a few regions such as North America and the Alps. In these regions, glaciers changes are particularly well documented.
Journal Reference:
Ben Marzeion, J. Graham Cogley, Kristin Richter, and David Parkes. Global glacier mass loss to anthropogenic and natural causes. Science, 1254702. Published online 14 August 2014 [DOI:10.1126/science.1254702]
View abstract: http://www.sciencemag.org/content/early/2014/08/13/science.1254702
Sea Level Rise in Western Tropical Pacific is a Result of Human Activity According to Study
Fri, 15th August, 2014
Source: University of Colorado, Boulder, Newsroom
Posted by Jenny Griffin
A new study led by Old Dominion University and the University of Colorado Boulder indicates sea levels likely will continue to rise in the tropical Pacific Ocean off the coasts of the Philippines and northeastern Australia as humans continue to alter the climate.
The study authors combined past sea level data gathered from both satellite altimeters and traditional tide gauges as part of the study. The goal was to find out how much a naturally occurring climate phenomenon called the Pacific Decadal Oscillation, or PDO, influences sea rise patterns in the Pacific, said Assistant Professor Benjamin Hamlington of Old Dominion University in Norfolk, Va., a former CU-Boulder postdoctoral researcher and lead study author.
The PDO is a temperature pattern in the Pacific Ocean akin to El Niño but which lasts roughly 20 to 30 years and contributes significantly to the decadal trends in regional and global sea level, said CU-Boulder Research Professor Robert Leben, a study co-author. The research team performed sea level reconstructions going back to 1950 by fitting patterns of satellite altimeter data to tide gauge data, then stripped away the effects of the PDO to better understand its influence on current sea level increases in the Pacific.
�The conventional wisdom has been that if the Pacific Decadal Oscillation was removed from the equation this sea level rise in parts of the Pacific would disappear,� said Hamlington, who received his doctorate from CU-Boulder. �But we found that sea level rise off the coasts of the Philippines and northeastern Australia appear to be anthropogenic and would continue even without this oscillation.�
A paper on the subject was published online in the July 20 issue of Nature Climate Change. Other co-authors on the study included CU-Boulder doctoral student Matthew Strassburg, CU-Boulder Associate Professor Weiqing Han, CU-Boulder Professor R. Steven Nerem and Seoul National University faculty member K.Y. Kim. The study was funded primarily by NASA and the National Science Foundation.
The team also used NASA climate models to assess sea level rise in the tropical Pacific that included data on the warming tropical Indian Ocean, which has been shown in previous studies to be caused by increases in greenhouse gases. The climate modeling portion of the new study also showed sea level rise near the Philippines and Australia is caused at least in part by anthropogenic, or human-caused, warming said Hamlington, who got his doctorate under Leben.
The research team estimated that areas of the ocean near the Philippines and northeast Australia are being raised by about 1 centimeter per year due to anthropogenic warming, which can increase the intensity of severe weather. �When water starts piling up there and typhoon-like storms are traveling over higher sea levels, it can be a bad situation,� said Hamlington.
Although global sea level patterns are not geographically uniform -- sea level rise in some areas correlate with sea level fall in other areas -- the average current global sea level rise is roughly 3 millimeters per year. Some scientists are estimating global seas may rise by a meter or more by the end of the century as a result of greenhouse warming.
�When the current PDO switches from its warm phase to its cool phase sea levels on the western coast of North America likely will rise,� said Leben of CU-Boulder�s aerospace engineering sciences department. �I think the PDO has been suppressing sea level there for the past 20 or 30 years.�
In a broader sense, the new study shows that scientists may be able to look at other regions of the world�s oceans and extract the natural climate variability in order to measure human-caused effects, said Hamlington, a researcher at CU-Boulder�s Cooperative Institute for Research in Environmental Sciences. �This kind of research may start revealing patterns that we might not expect.�
Most of the satellite altimeter data for the study came from NASA�s Topex-Poseidon and Jason satellite series missions. Satellite altimetry measures sea level rise by bouncing radar pulses off the surface of the ocean at particular points and calculating the round-trip time it takes the pulse to return to the spacecraft said Leben, also a faculty member of CU-Boulder�s Colorado Center for Astrodynamics Research, or CCAR.
A 2010 study led by CU-Boulder�s Han published in Nature Geoscience concluded that greenhouse gases were responsible for rising seas in parts of the Indian Ocean. The changes are believed to be at least partially a result of the roughly 1 degree Fahrenheit increase in the Indo-Pacific warm pool -- an enormous, bathtub-shaped area stretching from the east coast of Africa to the International Date Line in the Pacific -- during the past 50 years.
Journal Reference:
B. D. Hamlington, M. W. Strassburg, R. R. Leben, W. Han, R. S. Nerem, K-Y. Kim. Uncovering an anthropogenic sea-level rise signal in the Pacific Ocean. Nature Climate Change, 2014; DOI: 10.1038/nclimate2307
View paper abstract online at:
http://www.nature.com/nclimate/journal/vaop/ncurrent/full/nclimate2307.html
NOAA: 'Nuisance flooding' an increasing problem as coastal sea levels rise
Fri, 15th August, 2014
Source: NOAA
Posted by Jenny Griffin
Study looks at more than 60 years of coastal water level and local elevation data changes
Eight of the top 10 U.S. cities that have seen an increase in so-called "nuisance flooding"--which causes such public inconveniences as frequent road closures, overwhelmed storm drains and compromised infrastructure--are on the East Coast, according to a new NOAA technical report.
This nuisance flooding, caused by rising sea levels, has increased on all three U.S. coasts, between 300 and 925 percent since the 1960s.
The report, Sea Level Rise and Nuisance Flood Frequency Changes around the United States, also finds Annapolis and Baltimore, Maryland, lead the list with an increase in number of flood days of more than 920 percent since 1960. Port Isabel, Texas, along the Gulf coast, showed an increase of 547 percent, and nuisance flood days in San Francisco, California increased 364 percent.
"Achieving resilience requires understanding environmental threats and vulnerabilities to combat issues like sea level rise," says Holly Bamford, Ph.D., NOAA assistant administrator of the National Ocean Service. "The nuisance flood study provides the kind of actionable environmental intelligence that can guide coastal resilience efforts."
"As relative sea level increases, it no longer takes a strong storm or a hurricane to cause flooding," said William Sweet, Ph.D., oceanographer at NOAA's Center for Operational Oceanographic Products and Services (CO-OPS) and the report's lead author. "Flooding now occurs with high tides in many locations due to climate-related sea level rise, land subsidence and the loss of natural barriers. The effects of rising sea levels along most of the continental U.S. coastline are only going to become more noticeable and much more severe in the coming decades, probably more so than any other climate-change related factor."
The study was conducted by scientists at CO-OPS, who looked at data from 45 NOAA water level gauges with long data records around the country and compared that to reports of number of days of nuisance floods.
The extent of nuisance flooding depends on multiple factors, including topography and land cover. The study defines nuisance flooding as a daily rise in water level above the minor flooding threshold set locally by NOAA's National Weather Service, and focused on coastal areas at or below these levels that are especially susceptible to flooding.
The report concludes that any acceleration in sea level rise that is predicted to occur this century will further intensify nuisance flooding impacts over time, and will further reduce the time between flood events.
The report provides critical NOAA environmental data that can help coastal communities assess flooding risk, develop ways to mitigate and adapt to the effects of sea level rise, and improve coastal resiliency in the face of climate- and weather-induced changes.
Top ten U.S. areas with an increase in nuisance flooding (More than one flood on average between 1957-1963), and for nuisance levels (Meters above mean higher than high water mark) above 0.25 meters:
Annapolis, Md.
Baltimore, Md.
Atlantic City, N.J.
Philadelphia, Pa.
Sandy Hook, N.J.
Port Isabel, Texas
Charleston, S.C.
Washington D.C.
San Francisco, Calif.
Norfolk, Va.
The report can be downloaded from here:
http://www.noaanews.noaa.gov/stories2014/20140728_nuisanceflooding.html
Uncorking East Antarctica Will Trigger Uncontrollable Sea Level Rise
Sat, 7th June, 2014
By Jenny Griffin
A relatively small volume of ice melt on the East Antarctica shoreline could trigger a steady flow of ice into the surrounding ocean, which would result in uncontrollable sea level rise that would continue for thousands of years into the future, according to a study that was recently published in Nature Climate Change. The results of the study, conducted by researchers based at the Potsdam Institute for Climate Impact Research (PIK), were determined using computer simulations of ice flow in Antarctica based on updated data of the profile of the ground below the ice sheet.
According to lead author, Matthias Mengel: "East Antarctica's Wilkes Basin is like a bottle on a slant; once uncorked, it empties out." In East Antarctica the Wilkes Basin comprises the largest area of marine ice that sits on top of a rocky substrate. The ice within this basin is currently held in place by an icy rim along the coastal front that in effect acts as a plug, preventing the ice behind it from flowing into the ocean in much the same manner as a cork prevents liquid from spewing out of a bottle. Although Antarctic air temperatures have remained low, ocean warming can contribute to coastal ice loss, melting ice sheets from below. This could cause this relatively thin rim of ice to disappear, and once it is lost it would allow ice upstream to flow freely into the ocean, which would trigger an unstoppable long-term rise in sea levels of 3-4 meters. According to Anders Levermann, a co-author of the study: "The full sea-level rise would ultimately be up to 80 times bigger than the initial melting of the ice cork."
"Until recently, only West Antarctica was considered unstable, but now we know that its ten times bigger counterpart in the East might also be at risk," says Levermann, who heads PIK's research group, Global Adaptation Strategies, and is also a lead-author of the chapter on sea level change in the Intergovernmental Panel on Climate Change (IPCC) report on Climate Change published in September 2013, which has projected that Antarctica will contribute a sea level rise of up to 16 centimeters by the end of the century. According to Levermann: "If half of that ice loss occurred in the ice-cork region, then the discharge would begin. We have probably overestimated the stability of East Antarctica so far."
Greenhouse Gas Emissions Could Trigger Unstoppable Ice Melt
Melting would cause the grounding line -- the area where the ice that sits on the rocky substrate of the continent meets the ocean and floats on top of sea water -- to retreat inland. The rocky substrate below the ice consists of a large sloping valley that is below sea level and penetrates deep inland. Should the grounding line retreat from the ridge where it is currently positioned into the deeper valley, the rim of ice at the front that meets the ocean will become higher than it currently is. Consequently, more ice will be forced into the ocean, shearing off or calving into the ocean where it will eventually melt, adding water to the oceans. The warmer the surrounding air and water temperatures get, the faster this will occur.
According to the study's computer simulations, it will take between 5,000 to 10,000 years for the Wilkes Basin to completely discharge all its ice. However, although the pace at which ice discharges may be slow, once it commences it will continue relentlessly until the entire basin is drained of ice, even if warming was halted.
"This is the underlying issue here", says Matthias Mengel. "By emitting more and more greenhouse gases we might trigger responses now that we may not be able to stop in the future." Such an extensive rise in sea levels would change the face our planet, placing large coastal cities such as New York, Tokyo and Mumbai, and all who live there, at risk.
Journal References:
Mengel, M., Levermann, A. (2014): Ice plug prevents irreversible discharge from East Antarctica. Nature Climate Change (online) [DOI: 10.1038/NCLIMATE2226]
Weblink to the article: http://www.nature.com/nclimate/journal/vaop/ncurrent/full/nclimate2226.html
Levermann, A., Bamber, J., Drijfhout, S., Ganopolski, A., Haeberli, W., Harris, N.R.P., Huss, M., Krüger, K., Lenton, T., Lindsay, R.W., Notz, D., Wadhams, P., Weber, S. (2012): Potential climatic transitions with profound impact on Europe - Review of the current state of six 'tipping elements of the climate system'. Climatic Change 110 (2012), 845-878, [DOI 10.1007/s10584-011-0126-5]
Weblink to article: http://link.springer.com/article/10.1007/s10584-011-0126-5
Future Climate Could Destabilize Atlantic Deep Ocean Circulation
Sat, 15th March, 2014
By Jenny Griffin
A new study assessing climate change in the past, questions whether future changes will occur abruptly or whether temperature will increase gradually over a longer time period.
Currently, deep oceanic waters globally consist of water that was formed at great depths in the northern North Atlantic Ocean. This flow of water plays an important role in the absorption of atmospheric CO2 emissions produced by burning fossil fuels, and affects sea level and climatic conditions in the Atlantic. Any change to this oceanic circulation pattern could potentially result in a climate change tipping point that could lead to dramatic large scale impacts that could be long-lasting. These impacts include changes in sea level, changes in the intensity and timing of droughts experienced in the Sahel region in Africa, and changes to both the rate at which ocean acidification is occurring and the rate at which CO2 is absorbed by the oceans.
The pattern of deep ocean circulation has up until now been considered to be relatively stable under warm climatic conditions, similar to those projected towards the end of this century. However, a recent study conducted by scientists based at Bjerknes Centre of Climate Research at the University of Bergen (UiB) and Uni Research in Norway together with assistance from international colleagues from the UK, France and the USA, indicates that Atlantic deep water formation is likely to be far more tenuous that previously thought.
In order to gain insights into the future, scientists often look at the past, as was the case in this study. By looking at conditions in the last interglacial period (125,000 years ago) when ocean waters of the North Atlantic were warmer and fresher, and sea level higher than it is currently � similar to conditions projected for the future by climate models � the scientists hoped to get the answers they sought. In order to reconstruct conditions on the ocean's surface 125,000 years ago, together with the deep ocean circulation patterns associated with these conditions, the research team analyzed shells of foraminifera � a minute, single-celled species of plankton found in deep waters � which they collected from sediments on the ocean floor in the North Atlantic.
�At that time, there were a series of sudden and large reductions in the influence of these North Atlantic waters in the deep ocean. These deep water reductions occurred repeatedly, each lasting for some centuries before bouncing back. The unstable circulation operated as if it was near a threshold and flickered back and forth across it,� says Eirik Vinje Galaasen, a PhD student and now researcher at UiB's Department of Earth Science, who is the lead author of the paper published in the journal Science.
�These types of changes hadn't been noticed before because they are so short-lived. Geologists hadn't focused on century scale ocean changes because they are difficult to detect,� adds Professor Ulysses Ninnemann, from UiB's Department of Earth Science.
By analyzing traces of deep ocean properties contained within marine sediments from mud core samples collected from the North Atlantic seafloor, the research team could in effect go back in time and reconstruct changes that occurred at an abyssal oceanic location south of Greenland acute to changes due to North Atlantic deep water. At this site, mud accumulates at a rate that is approximately 10 times greater than normal, allowing for shorter changes to be recorded compared to other locations. While these geological changes are relatively short, a reduction in the rate of deep water flow could have a huge impact on societies that would have to deal with the accompanying fluctuations in sea level and droughts associated with these changes.
One popular notion is that a decline in ocean circulation could result in large-scale cooling, which could cause a new ice age, as reflected in the Hollywood blockbuster The Day After Tomorrow. While some local cooling was recorded south of Greenland when ocean circulation slowed, no evidence of large-scale cooling was observed with these changes, an indication that a super-cooling event did not force the next ice age. It may be that we just haven't found evidence to prove this yet, but equally reasonable is that humankind simply don't get really big cooling as the ocean slows down because when it is really warm, sea ice cannot form, and this supercharges the cooling effect of ocean circulation changes.
Is this likely to happen to the Earth in future? Many climate models have in fact predicted that there will be a slow, gradual decline in the North Atlantic circulation in the course of the next century, but the scenarios predicted for the future vary widely between models. Although future climate patterns will not be exactly the same as those experienced during the last interglacial period, there will be some similarities � for one, the ocean waters of the northern Atlantic will be fresher and a few degrees warmer. Training models, if models can capture the types of changes we see in the past, may also be doing a good job at predicting the future. The seafloor evidence suggests that there were large and fast changes in circulation the last time the ocean looked the way it may look by the end of this century.
�Our study demonstrates that deep water formation can be disrupted by the freshening of the regional surface water, which might happen due to enhanced precipitation and glacier melting under future climate change scenarios,� explains Yair Rosenthal, a co-author on the paper.
Journal Reference:
Galaasen EV, Ninnemann US, Irvali N, Kleiven HF, Rosenthal Y, Kissel C, Hodell DA. (2014). Rapid Reductions in North Atlantic Deep Water During the Peak of the Last Interglacial Period. Science Vol. 343 no. 6175 pp. 1129-1132 DOI: 10.1126/science.1248667
Sea Level Rise Forecasts Helped by Insights into Glacier Melting
Sun, 29th December, 2013
Predictions of sea level rise could become more accurate, thanks to new insight into how glacier movement is affected by melting ice in summer.
Studies of the Greenland ice sheet, including during a record warm summer, are helping scientists better understand how summer conditions affect its flow. This is important for predicting the future contribution made by melting glaciers to sea level rise.
Ice flows slowly from the centre of the Greenland Ice Sheet towards its margins, where it eventually melts or calves into the ocean as icebergs. Knowing how fast this movement occurs is essential for predicting the contribution of the ice sheet to sea level rise.
In summer, ice from the surface of a glacier melts and drains to the bed of the ice sheet, initially raising water pressure at the base and enabling the glacier to slide more quickly. It can, at times, move more than twice as fast in summer compared with winter, they found.
In 2012, an exceptionally warm summer caused the Greenland Ice Sheet to undergo unprecedented rates of melting. However, researchers have found that fast summer ice flow caused by significant melting is cancelled out by slower motion the following winter.
Scientists found that this is because large drainage channels, formed beneath the ice by the meltwater, helped to lower the water pressure, ultimately reducing the sliding speed.
The discovery suggests that movement in the parts of the ice sheet that terminate on land are insensitive to surface melt rates. It improves scientists' understanding of how the ice sheet behaves and curbs error in estimating its contribution to sea level rise in a warming world.
Scientists led by the University of Edinburgh gathered detailed GPS ice flow data and ice surface melt rates along a 115 km transect in west Greenland and compared ice motion from an average melt year, 2009, with the exceptionally warm year of 2012.
The study, carried out in collaboration with the Universities of Sheffield, Aberdeen, Tasmania and Newcastle, was published in Proceedings of the National Academy of Sciences and supported by the Natural Environment Research Council.
Professor Peter Nienow of the University of Edinburgh's School of GeoSciences, who led the study, said: "Although the record summer melt did not intensify ice motion, warmer summers will still lead to more rapid melting of the ice sheet. Furthermore, it is important that we continue to investigate how glaciers that end in the ocean are responding to climate change."
Journal Reference:
Tedstone AJ, Nienow PW, Sole AJ, Mair DW, Cowton TR, Bartholomew ID, King MA. Greenland ice sheet motion insensitive to exceptional meltwater forcing. Proceedings of the National Academy of Sciences, 2013; 110(49) [DOI: 10.1073/pnas.1315843110]
Source: EurekAlert.org
Sea-Level Rise to Drive Coastal Flooding, Regardless of Changes in Hurricane Activity
Sun, 29th December, 2013
Review of studies show that sea-level rise, shoreline retreat will drive storm-related flooding.
Clamor about whether climate change will cause increasingly destructive tropical storms may be overshadowing a more unrelenting threat to coastal property � sea-level rise � according to a team of researchers writing in the journal Nature this week.
After reviewing nearly 100 research studies, the
scientists say accelerated sea-level rise certainly will increase the flooding and property damage triggered by tropical cyclones � commonly known as hurricanes in the Atlantic and Northern Pacific � but predicting where, how often, and how powerful these storms will be when they make landfall is full of uncertainty.
"The potential for sea-level rise to dramatically change the landscape is an understudied aspect of coastal flooding," said Jennifer Irish, an associate professor of civil and environmental engineering with the Virginia Tech College of Engineering. "For example, shoreline erosion, barrier-island degradation, and new tidal inlet formation � these sedimentary changes could lead to catastrophic changes in hurricane flood risk in some areas."
The research team, led by Jonathan D. Woodruff, an assistant professor of sedimentology and coastal processes at the University of Massachusetts Amherst, with Irish and Suzana Camargo, a Lamont research professor at the Lamont-Doherty Earth Observatory of Columbia University, said regardless of changes in storm activity, rising sea levels will become the dominant driver of flooding and coastal damage.
The scientists cited information from the International Disaster Database of the Center for Research on the Epidemiology of Disasters that indicates since 1970, more than 60 percent of all economic losses � about $400 billion � occurred in the North Atlantic, even though it is one of the least active basins for hurricanes.
The researchers stressed the importance of a holistic approach to manage coastal systems, especially in the context of almost certain flooding from tropical cyclones because of rising sea levels.
"Sea-level rise, severe storms, changing climate, erosion, and policy issues are just some of the factors to assess in order to understand future risk," Irish said. "We reviewed just three of the physical factors � tropical cyclone climatology, sea-level rise, and shoreline change. If we look at them separately, we don't see how they are interconnected. But if we pull back to look at the whole picture, we stand a better chance of protecting our homes, roadways, energy and water networks, and the most critical and expensive infrastructure along the coastlines."
The review suggested that it is practical to focus on approaches that integrate vertical and landward retreat � meaning planners should consider elevated structures and building further inland � with other engineering and management measures, including sediment management.
Global sea level is expected to rise about one meter by 2100. According to a simulation study the researchers reviewed, floods currently to be considered 100-year events in New York City could become three- to 20-year events.
"It is widely accepted that sea level will rise. We just don't know how much," Irish said. "We need to consider the full range of sea-level estimates and plan our engineering strategies from that, designing for moderate protection now in a way that these designs can be modified in the future if necessary. The Dutch have been dealing with this problem for centuries, so it can be done."
Journal Reference:
Jonathan D. Woodruff, Jennifer L. Irish & Suzana J. Camargo. Coastal flooding by tropical cyclones and sea-level rise. Nature 504, 44�52 (05 December 2013) [doi:10.1038/nature12855]
Source: EurekAlert.org
Sandy's Lessons Include: Put Parks, Not Houses, on the Beach
Sun, 29th December, 2013
Boulder, CO, USA - Just days before Hurricane Sandy hit the New York and New Jersey coastline on 29 October 2012, scientists from the City University of New York's (CUNY) College of Staten Island had produced the most detailed model to date of the region's potential for damage from big storms. So naturally, the morning after the floods receded from Staten Island, CUNY geology professor Alan I. Benimoff was out mapping the high-water marks in the flooded neighborhoods. There he discovered that his team's pre-Sandy model had been right on the money.
Sandy caused 40 deaths and massive damage in New York City -- yet future storms could be worse, according to Benimoff and his colleagues. At the 2013 Geological Society of America (GSA) meeting in Denver, they described how the combination of rising sea level and more frequent, more severe hurricanes could bring Atlantic water much higher.
Their new flood model predicts that Staten Island and Long Island would again flood in low-lying areas, such as South Beach, with their working-class neighborhoods and beachfront boardwalks, and could even surpass Sandy levels. In Manhattan, the storm surge could extend past the low areas that flooded in Sandy, which included Battery Park subway tunnels, the Financial District, and a 14th Street electrical substation.
The researchers are geology professors Benimoff and William J. Fritz; Michael Kress, director of the CUNY Interdisciplinary High Performance Computer Center, vice president for technology systems, and professor of computer science; and undergraduate student Liridon Sela.
Since Sandy, Benimoff and Fritz, who is interim president of College of Staten Island, have been active in the community discussions about how -- or whether -- to rebuild on the most vulnerable parts of the barrier islands. They have developed five recommendations for area policy makers, emergency agencies and residents.
In public discussions, Benimoff does not mince words. As a scientist, he says, he has an obligation to communicate data clearly to non-scientists.
"To paraphrase our governor: There are some parcels of land that Mother Nature owns, and when she comes to visit, she visits," Benimoff says. "The reality is that these particular barrier islands are uniquely vulnerable to storm surges. They have a lot of coastal and wetland that never should have been built on."
"What's more, they have a geometry of coastline where Coney Island and Sandy Hook make a right angle with Staten Island right at the apex, and the seafloor comes up very gradually. Water piles up in that corner and has nowhere to go but inland. That means any storm that comes perpendicular to the coastline of New Jersey is going to put us in harm's way."
The College of Staten Island scientists' five-point plan recommends:
1. Protect the existing natural barriers - the beaches and dunes;
2. Build them higher;
3. Rezone in the flood zone to prevent home construction. Buy these properties and turn them into parks, which will sponge up the inevitable floodwaters and partially protect the islands' higher lands. (There is precedent for this -- after 157 people died in 1946 and 1960 tsunamis in Hilo, Hawaii, the most damaged neighborhoods were turned into parks.)
4. Be very careful about engineering solutions such as sea barriers because they will not only be expensive but also protect one stretch of beach at the expense of its neighbor. "Jetties, sandbars, seawalls -- these are merely Band-Aids," Benimoff says. "You've got to face the music here."
5. Teach coastal residents how to survive a hurricane: Stay informed by watching weather forecasts. Evacuate early. Don't seek refuge in basements, which could flood. Know your area's high ground and, if faced with rapidly rising waters, go there.
Source: EurekAlert.org
New Jersey Shore Likely Faces Unprecedented Flooding by Mid-Century
Sun, 29th December, 2013
Scientists project Shore sea level to rise 11 to 15 inches higher than global average for next century.
Geoscientists at Rutgers and Tufts universities estimate that the New Jersey shore will likely experience a sea-level rise of about 1.5 feet by 2050 and of about 3.5 feet by 2100 � 11 to 15 inches higher than the average for sea-level rise globally over the century.
That would mean, the scientists say, that by the middle of the century, the one-in-10 year flood level at Atlantic City would exceed any flood known there from the observational record, including Superstorm Sandy.
Ken Miller, Robert Kopp, Benjamin Horton and James Browning of Rutgers and Andrew Kemp of Tufts base their projections in part upon an analysis of historic and modern-day records of sea-level rise in the U.S. mid-Atlantic region. Their research appears in the inaugural issue of the journal Earth's Future, published on the 5th December 2013 by the American Geophysical Union. It builds upon a recent study by Kemp, Horton and others that reconstructed a 2,500-year record of sea level at the New Jersey shore. Horton is a professor of marine and coastal sciences in Rutgers' School of Environmental and Biological Sciences; Kemp, an assistant professor of Earth and ocean sciences at Tufts.
"It's clear from both the tide gauge and geological records that sea level has been rising in the mid-Atlantic region at a foot per century as a result of global average sea-level rise and the solid earth's ongoing adjustment to the end of the last ice age," said Miller, a professor of Earth and planetary sciences in Rutgers' School of Arts and Sciences. "In the sands of the New Jersey coastal plain, sea level is also rising by another four inches per century because of sediment compaction � due partly to natural forces and partly to groundwater withdrawal. But the rate of sea-level rise, globally and regionally, is increasing due to melting of ice sheets and the warming of the oceans."
Sea-level rise in the mid-Atlantic region also results from changes in ocean dynamics, the scientists said. "Most ocean models project that the Gulf Stream will weaken as a result of climate change � perhaps causing as much as a foot of additional regional sea-level rise over this century," said Kopp, an assistant professor of Earth and planetary sciences and associate director of the Rutgers Energy Institute.
The researchers said sea-level rise could be higher � 2.3 feet by mid-century and 5.9 feet by the end of the century � depending on how sensitive the Gulf Stream is to warming and how fast the ice sheets melt in response to that warming.
Either way, the researchers' study of past sea-level change also revealed that something remarkable started happening over the last century. It's not only temperatures that have been veering upward as a result of greenhouse gas emissions. "The geological sea-level records show that it's extremely likely that sea-level in New Jersey was rising faster in the 20th century than in any century in the last 4300 years," Kemp said.
The unprecedented 20th-century sea-level rise had a significant human impact. The study found that the eight inches of climate change-related regional sea-level rise in the 20th century exposed about 83,000 additional people in New Jersey and New York City to flooding during 2012's Superstorm Sandy.
Journal Reference:
Miller, K. G., Kopp, R. E., Horton, B. P., Browning, J. V. and Kemp, A. C. (2013), A geological perspective on sea-level rise and its impacts along the U.S. mid-Atlantic coast. Earth's Future. doi: 10.1002/2013EF000135
The article is available with open access on the Earth's Future website at: http://onlinelibrary.wiley.com/doi/10.1002/2013EF000135/abstract
Source: EurekAlert.org
Expert Assessment: Sea-Level Rise Could Exceed 1 meter this Century
Sun, 29th December, 2013
In contrast, for a scenario with strong emissions reductions, experts expect a sea-level rise of 40-60 centimeters by 2100 and 60-100 centimeters by 2300. The survey was conducted by a team of scientists from the USA and Germany.
"While the results for the scenario with climate mitigation suggest a good chance of limiting future sea-level rise to one meter, the high emissions scenario would threaten the survival of some coastal cities and low-lying islands," says Stefan Rahmstorf from the Potsdam Institute for Climate Impact Research. "From a risk management perspective, projections of future sea-level rise are of major importance for coastal planning, and for weighing options of different levels of ambition in reducing greenhouse-gas emissions."
Projecting sea-level rise, however, comes with large uncertainties, since the physical processes causing the rise are complex. They include the expansion of ocean water as it warms, the melting of mountain glaciers and ice caps and of the two large ice sheets in Greenland and Antarctica, and the pumping of ground water for irrigation purposes. Different modeling approaches yield widely differing answers. The recently published IPCC report had to revise its projections upwards by about 60 percent compared to the previous report published in 2007, and other assessments of sea-level rise compiled by groups of scientists resulted in even higher projections. The observed sea-level rise as measured by satellites over the past two decades has exceeded earlier expectations.
Largest elicitation on sea-level rise ever: 90 key experts from 18 countries
"It this therefore useful to know what the larger community of sea-level experts thinks, and we make this transparent to the public," says lead author Benjamin Horton from the Institute of Marine and Coastal Sciences at Rutgers University in New Jersey. "We report the largest elicitation on future sea-level rise conducted from ninety objectively selected experts from 18 countries." The experts were identified from peer-reviewed literature published since 2007 using the publication database 'Web of Science' of Thomson Reuters, an online scientific indexing service, to make sure they are all active researchers in this area. 90 international experts, all of whom published at least six peer-reviewed papers on the topic of sea-level during the past 5 years, provided their probabilistic assessment.
The survey finds most experts expecting a higher rise than the latest IPCC projections of 28-98 centimeters by the year 2100. Two thirds (65%) of the respondents gave a higher value than the IPCC for the upper end of this range, confirming that IPCC reports tend to be conservative in their assessment.
The experts were also asked for a 'high-end' estimate below which they expect sea-level to stay with 95 percent certainty until the year 2100. This high-end value is relevant for coastal planning. For unmitigated emissions, half of the experts (51%) gave 1.5 meters or more and a quarter (27%) 2 meters or more. The high-end value in the year 2300 was given as 4.0 meters or higher by the majority of experts (58%).
While we tend to look at projections with a focus on the relatively short period until 2100, sea-level rise will obviously not stop at that date. "Overall, the results for 2300 by the expert survey as well as the IPCC illustrate the risk that temperature increases from unmitigated emissions could commit coastal populations to a long-term, multi-meter sea-level rise," says Rahmstorf. "They do, however, illustrate also the potential for escaping such large sea-level rise through substantial reductions of emissions."
Journal Reference:
B. P. Horton, S. Rahmstorf, S. E. Engelhart, A.C.Kemp: Expert assessment of sea-level rise by AD 2100 and AD 2300. Quaternary Science Reviews (2013). [doi: 10.1016/j.quascirev.2013.11.002]
The article is available online from Science Direct at: http://dx.doi.org/10.1016/j.quascirev.2013.11.002
Source: EurekAlert.org
Scientists Develop New Method to Help Coasts Adapt to Sea-Level Rise
Sun, 29th December, 2013
A team of scientists, led by the University of Southampton, has developed a new method to help the world's coasts adapt to global sea-level rises over the next 100 years.
Future sea-level rise seems inevitable, although the rates and geographical patterns of change remain uncertain. Given the large and growing populations and economic activity in coastal zones, as well as the importance of coastal ecosystems, the potential impacts of sea-level change are far-reaching.
Current methods to assess the potential impact of sea-level rise have varied significantly and hindered the development of useful scenarios and in turn, suitable adaption policies and planning.
A new study led by Professor Robert Nicholls from the University of Southampton, has combined the available data on a number of different climate and non-climate (such as uplift, subsidence and natural phenomena - earthquakes for example) mechanisms, which contribute to sea-level change, to create appropriate scenarios of sea-level rise at any location when policy-makers consider impacts and adaption.
Professor Robert Nicholls says: "The goal here is not to 'scare people' but rather to encourage policy makers to think across the full range of possibilities. Hence, the problem can be addressed in a progressive and adaptive manner where sea-level rise is planned for now, and that plan includes monitoring and learning about sea-level change over the coming decades. This means that sea-level rise can be fully prepared for without over-adapting."
"Given that the uncertainties of sea-level rise are global, this approach will probably be widely applicable around the world's coasts, especially in major coastal cities with high values and growing flood risk."
To help develop the scenarios, the scientists from the universities of Southampton, Durham, Reading and Curtin University in Australia, along with the United Nations Development Programme, considered a wide range of situations - from cases of little data and few or no previous studies, to those where significant data and experience of earlier studies are available. This allowed them to explore the full range of uncertainties and risks to avoid estimates of sea-level impacts being made invalid every time new projections were published.
The timescale for the study is between 30 and 100 years into the future as this corresponds to the most relevant timescales considered for most developments in coastal zones.
Professor Nicholls adds: "The robustness of these results will vary according to the data available and/or the assumptions made for each sea-level change component, so these assumptions should always be explicit within the assessment report."
The paper 'Sea-level scenarios for evaluating coastal impacts' is published in the journal WIREs Climate Change. It is based on guidance on producing sea-level rise scenarios for impact and adaptation assessment, which was developed for the Intergovernmental Panel on Climate Change (IPCC) Task Group on Scenarios for Climate Impact Assessment (TGCIA) and available on their web site - http://www.ipcc-data.org/docs/Sea_Level_Scenario_Guidance_Oct2011.pdf
Source: EurekAlert.org

CLIMATE EMERGENCY INSTITUTE
The health and human rights approach to climate change
The health and human rights approach to climate change
Sea level rise is abrupt and accelerating
5 Dec 2018 Greenland is losing ice at fastest rate in 350 years
26 June 2017 The increasing rate of global mean sea-level rise during 1993–2014.
Sea level rise increased from about 50% in 1993 to 70% in 2014 with the largest, and statistically significant, increase coming from the contribution from the Greenland ice sheet, which is less than 5% of the GMSL rate during 1993 but more than 25% during 2014.
2014 Research
US cities SLR commitments
From 2015 Carbon choices determine US cities committed to futures below sea level
In this baseline case we find that cumulative emissions through 2015 already have locked in 1.6 m (0–3.7 m) of global sea level rise (SLR) relative to the present level. Sea-level commitment rises to 2.2 m (0.4–4.0 m) after factoring in future emissions implied by the current energy
infrastructure and reaches medians of 2.4 or 7.1 m by the end of the century under RCP 2.6 or 8.5, respectively. Our findings here illustrate the strong sensitivity of committed SLR to emissions
Committed submergence of US coastal cities under the best and worst IPCC 2014 emissions scenarios (2015, Carbon choices determine US cities committed to futures below sea level)
RCP 2.6 is 1.6C warming by 2100 (the world is committed/locked in to this)
RCP 8.5 is 4.3C warming by 2100 (the world is close to this track)
RCP 2.6 is 1.6C warming by 2100 (the world is committed/locked in to this)
RCP 8.5 is 4.3C warming by 2100 (the world is close to this track)
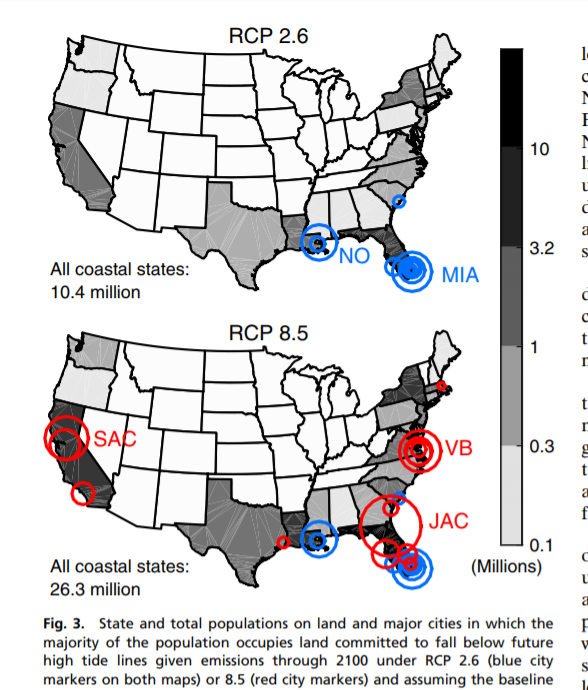
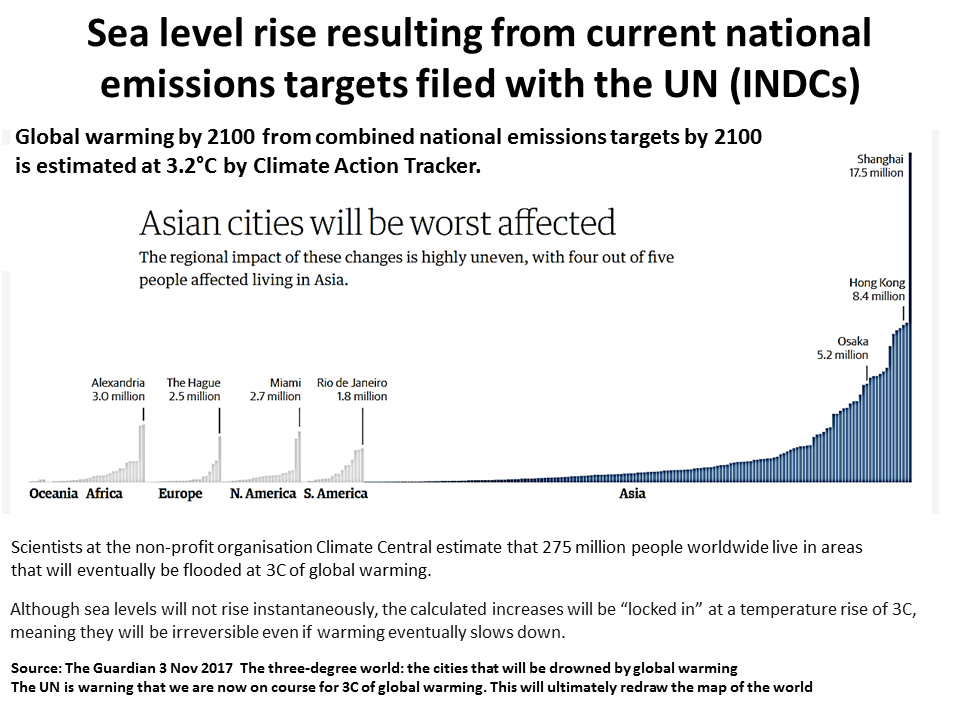
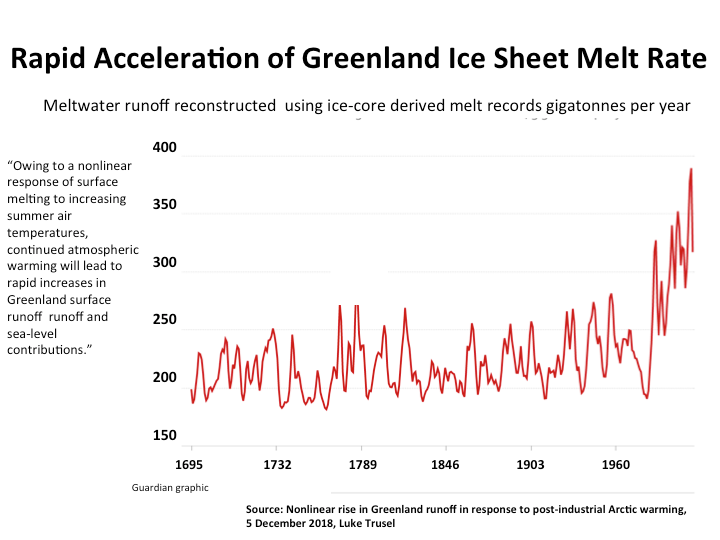

11 March 2020 Six-fold increase in polar ice losses since the 1990s
Combined losses from both ice sheets peaked at 552 billion tonnes per year in 2010 and averaged 475 billion tonnes per year for the remainder of the decade. The peak loss coincided with several years of intense surface melting in Greenland, and last summer’s Arctic heatwave means that 2019 should set a new record for polar ice sheet loss. Antarctica and Greenland are now losing ice five and seven times faster than they were in the 1990s, respectively.