State of the Climate
NOAA.
National Oceanic & Atmospheric Administration
National Oceanic & Atmospheric Administration
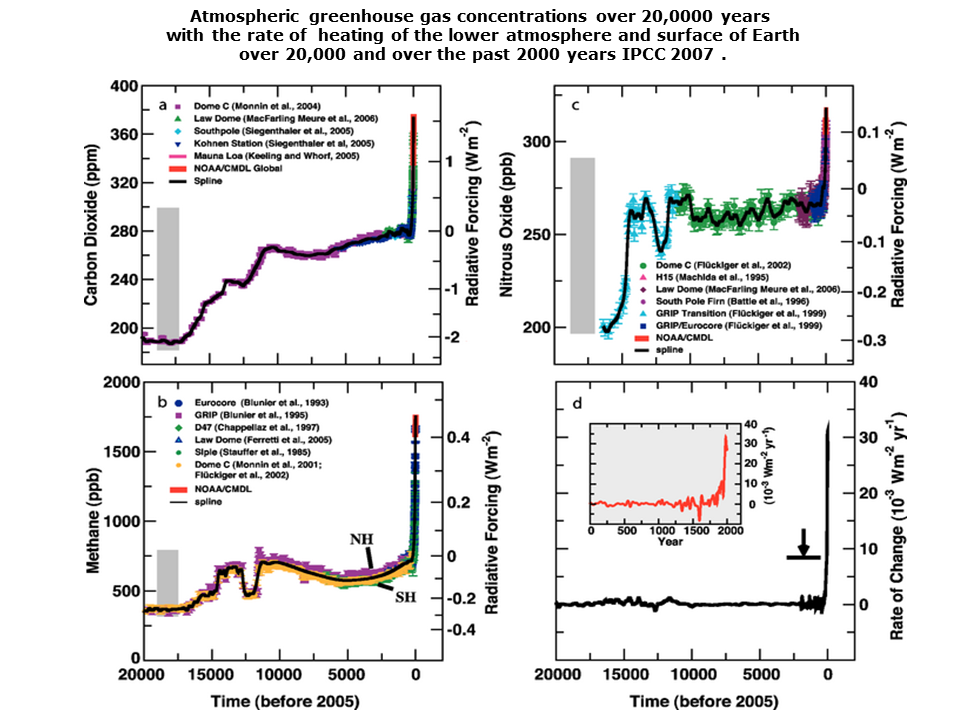
Atmospheric GHG concentrations &
climate system heating
over past 20,000 years
climate system heating
over past 20,000 years
NASA
National Aeronautics and Space Administration
National Aeronautics and Space Administration
NASA interactive global temperature increase maps (click image)
NOAA
interactive
climate monitoring
Temp oC,
precipitation,
drought
climate monitoring
Temp oC,
precipitation,
drought
US EPA greenhouse gases
Climate Change Indicators
US and global
(scroll to bottom for global)
US and global
(scroll to bottom for global)
WMO
World Meteorological
Organization
World Meteorological
Organization
NOAA
global warming FAQs
global warming FAQs
Covers the basic science and all the indicators
Global warming is much more than the global average surface temperature increase, and there are various climate change indexes that combine various global warming/climate change indicators, that better reflect planetary warming.
Best source of US & global climate information
.
.
.
The state of global climate planetary emergency is definite because of the combination of today's climate state (recorded by science) and the science of climate change commitment -locked in heating.
The renewed sustained post 2007 atmospheric methane increase, attributed to feedback process warming wetland peat, is particularly ominous. Sept 2013 carbon sources and sinks research indicates increased methane from record coal mining and from warming wetlands.
The renewed sustained post 2007 atmospheric methane increase, attributed to feedback process warming wetland peat, is particularly ominous. Sept 2013 carbon sources and sinks research indicates increased methane from record coal mining and from warming wetlands.
10 Sept 2015 James Hansen “We’ve now got an emergency,” “Amplifying impacts” and feedback loops will accelerate the changes" “It will happen faster than you think,
”It is therefore imperative to stop using coal, oil and gas as energy sources now. We’ve already burned as much as we can afford"
“We’ve only felt the warming for half of the gases that are up there,”
”It is therefore imperative to stop using coal, oil and gas as energy sources now. We’ve already burned as much as we can afford"
“We’ve only felt the warming for half of the gases that are up there,”
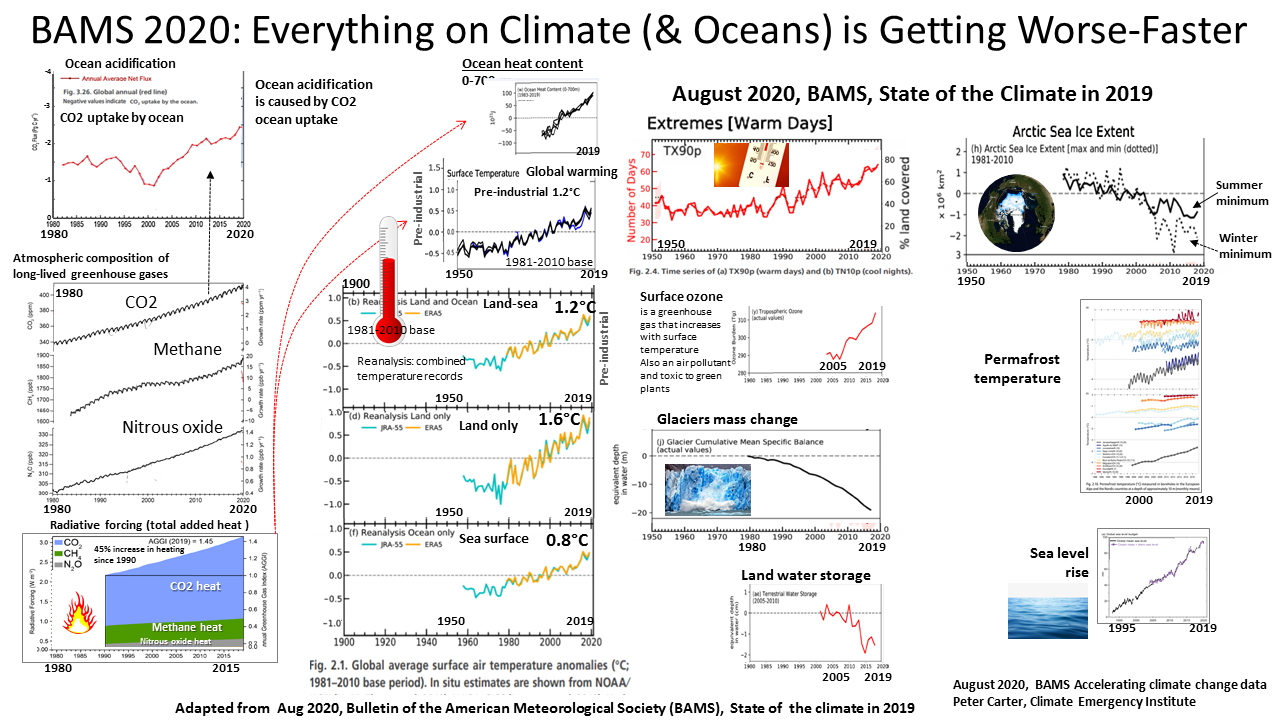
BAMS State of the Climate Special Bulletin of the American Meteorological Society
(last 2019)
(last 2019)
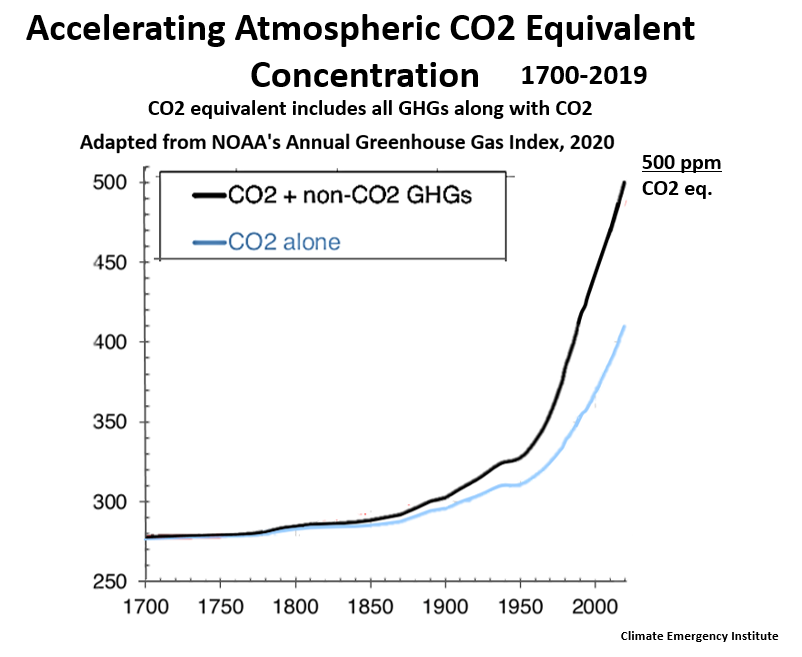
2019 Atmospheric CO2 equivalent 500 ppm!

1 Sep 2020: Multiple climate ocean indicators rapid trend to biosphere collapse
PDF Multiple climate ocean indicators
PDF Multiple climate ocean indicators