IPCC AR5 2014
Key IPCC Quotes AR5 2014
Compiled by Peter Carter
Already committed (locked-in) future climate change
o The commitment from constant greenhouse gas concentrations would correspond to approximately 2°C warming. (AR5 WG1 12.5.4.2)
o Many aspects of climate change will persist for centuries even if concentrations of greenhouse gases are stabilised. This represents a substantial multi-century commitment created by human activities today. (AR5 WG1 SPM)
o Global temperature equilibrium would be reached only after centuries to millennia if RF [radiative forcing or climate system heat] were stabilized. (AR5 WG1 Chapter 12 Executive Summary)
Extreme increase of atmospheric greenhouse gasesMultiple lines of evidence confirm that the long-lived greenhouse gases CO2, CH4, N2O all have increased substantially since 1750. There is very high confidence that they now exceed by 30%, 125%, 8%, respectively, the range of variability recorded in ice core records during past 800,000 years.
Planetary catastrophe warming risk by 2100
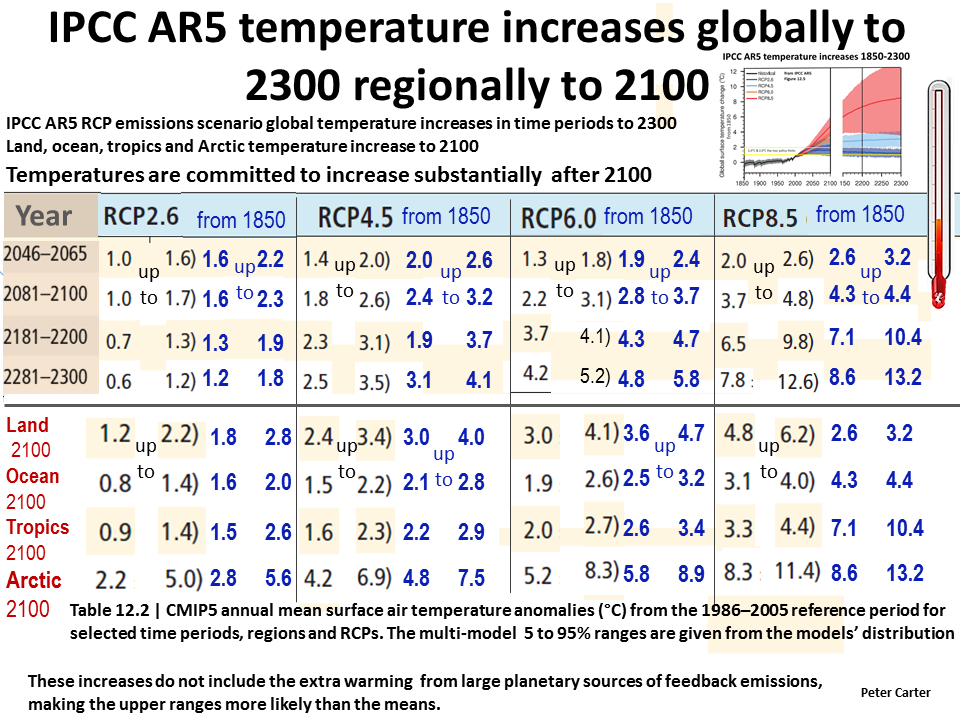
Risk of warming up to an unlivable 7.8°C by 2100
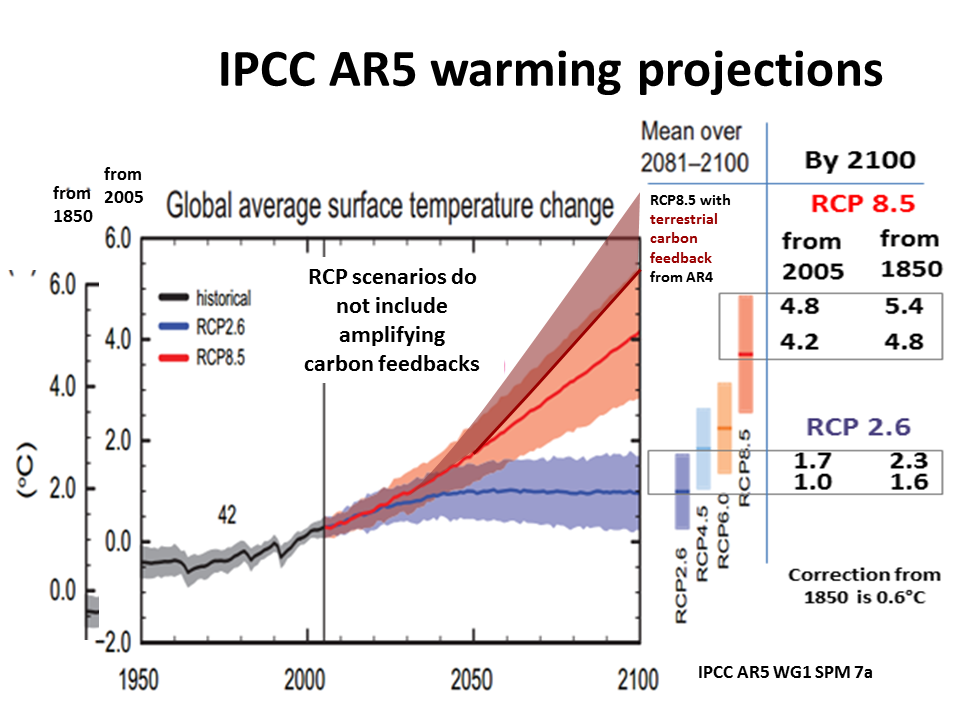
Without additional efforts to reduce GHG emissions, global mean surface temperature increases in 2100 from 3.7 to 4.8°C with a range to 7.8°C when including climate uncertainty. (AR5 WG3 SPM p. 8) ["Uncertainties" include the large sources of amplifying feedbacks that are not included in the AR5 global warming projections; these feedbacks are actually certain.]
Impacts to all continents and all oceans
In recent decades, changes in climate have caused impacts on natural and human systems on all continents and across the oceans. (AR5 WG2 SPM p. 4)
Climate change amplifies risks
Climate change is projected to amplify existing climate-related risks and create new risks for natural and human systems. Some of these risks will be limited to a particular sector or region, and others will have cascading effects. (WG2 SPM)
Drinking-water impacts
Freshwater-related risks of climate change increase significantly with increasing greenhouse gas concentrations. Climate change is projected to reduce raw water quality and pose risks to drinking water quality even with conventional treatment, due to interacting factors: increased temperature; increased sediment, nutrient, and pollutant loadings from heavy rainfall; increased concentration of pollutants during droughts; and disruption of treatment facilities during floods. The fraction of global population experiencing water scarcity and the fraction affected by major river floods increase with the level of warming in the 21st century. (AR5 WG2 SPM)
Urban populations
Heat stress, extreme precipitation, inland and coastal flooding, landslides, air pollution, drought, and water scarcity pose risks in urban areas for people, assets, economies, and ecosystems (very high confidence). (AR5 WG2 SPM)
Increasing extreme events
o Impacts from recent climate-related extremes, such as heat waves, droughts, floods, cyclones, and wildfires, reveal significant vulnerability and exposure of some ecosystems and many human systems to current climate variability. (AR5 WG2
SPM p. 6)
o It is very likely that anthropogenic forcing has contributed to the observed changes in daily temperature extremes since the mid-20th century. […] Models project increases in the duration, intensity and spatial extent of heat-waves. (AR5 WG1 SPM)
o More severe and/or frequent extreme weather events and/or hazard types are projected to increase losses and loss variability in various regions and challenge insurance systems to offer affordable coverage. (AR5 WG2 SPM)
Unique and vulnerable ecosystems and cultures
Some unique and threatened systems, including ecosystems and cultures, are already at risk from climate change and the number of such systems at risk of severe consequences is high at 1.6°C. (AR5 WG2 SPM)
PLANETARY CATASTROPHIC EFFECTS
Tipping points
With increasing warming from today, some ecosystems may be at risk of abrupt and irreversible changes. (AR5 WG2 SPM)
Abrupt Change
Several components or phenomena in the climate system could potentially exhibit abrupt or nonlinear changes, and some are known to have done so in the past. (AR5 WG1 Chapter 12)
Severe pervasive irreversible impacts
Increasing magnitudes of warming increase the likelihood of severe, pervasive, and irreversible impacts. (AR5 WG2 SPM p. 14)
Greenland ice sheet
There is high confidence that sustained warming greater than some threshold would lead to the near-complete loss of the Greenland ice sheet over a millennium or more, causing a global mean sea level rise of up to 7 m. Current estimates indicate that the threshold is greater than about 1°C... with respect to pre-industrial.(AR5 WG2 SPM)
Amplifying positive feedback Adds up to an extra 2.0C by 2100 The feedback between climate and the carbon cycle is positive in the 21st century and beyond. Models indicate a loss of carbon of 59 [20 to 98] PgC and 17 [13 to 21] PgC per °C warming from the land and the ocean, respectively [this is about 0.5C by 2100, but does not include large forest die-back, peat-lands and large Arctic feedback sources].
Permafrost feedback Until the year 2100, up to 250 PgC [picograms of carbon] could be released as CO2, and up to 5 Pg as CH4. Given methane's stronger greenhouse warming potential, that corresponds to a further 100 PgC of equivalent CO2 released until the year 2100 [so 350 PgC and about 1.5°C]. (AR5 WG1 FAQ 6.1)
FOOD INSECURITY
Negative effect on most crops already
Based on many studies covering a wide range of regions and crops, negative impacts of climate change on crop yields have been more common than positive impacts. (AR5 WG2 SPM p. 4)
Committed to declines of crops in all main food producing regions 1.0C
Above 1.0°C all crops in all regions decline [the policy makers changed this in the Summary for Policymakers,making it confusing]
Temperature increases in excess of about 1 degree C above pre-industrial [are] projected to have negative effects on yields for the major crops (wheat, rice and maize) in both tropical and temperate regions. (AR5 WG2 final science draft, Chapter 7, p.3)
Animal displacements will cause ... a drop in the fisheries of 40 to 60% in some of the tropics, for 2°C warming above pre-industrial levels (AR5 TS -68).
The future this century:
• reduced economic growth
• increased poverty
• reduced food security & increased hunger
Throughout the 21st century, climate-change impacts are projected to slow down economic growth, make poverty reduction more difficult, further erode food security, and prolong existing and create new poverty traps, the latter particularly in urban areas and emerging hotspots of hunger. (AR5 WG2 SPM p. 20)
Ocean acidification to be highly damaging to most marine life
[For all scenarios but the best-case (RCP2.6) emissions scenario],ocean acidification poses substantial risks to marine ecosystems, especially polar ecosystems and coral reefs, associated with impacts on the physiology, behavior, and population dynamics of individual species from phytoplankton to animals. […] Ocean acidification acts together with other global changes (e.g., warming, decreasing oxygen levels) and with local changes (e.g., pollution, eutrophication [algae overgrowth]) (high confidence). (AR5 WG2 SPM)
Ocean mass extinctions in Earth history occurred during much slower rates of ocean acidification, combined with other drivers changing, suggesting that evolutionary rates are not fast enough for sensitive ocean animals and plants to adapt to the projected rate of future change (AR5 WG2 130)
Combined multiple damaging effects on the oceans
Simultaneous drivers, such as warming and ocean acidification, can lead to interactive, complex, and amplified impacts for species and ecosystems. (AR5 WG2 SPM)
[Another such damaging driver is that some ocean oxygen levels are declining and there is] high agreement among modeling studies that O2 concentrations will continue to decrease in most parts of the Ocean due to the effect of temperature. (AR5 WG2 Technical Summary)
Increasing violent conflicts
Climate change can indirectly increase risks of violent conflicts in the form of civil war and inter-group violence by amplifying well-documented drivers of these conflicts such as poverty and economic shocks. Multiple lines of evidence relate climate variability to these forms of conflict. (AR5 WG2 SPM p. 20)
Considerable risks above 1°C Some risks of climate change are considerable at 1 or 2°C above pre-industrial levels. (AR5 WG2 SPM p. 14)
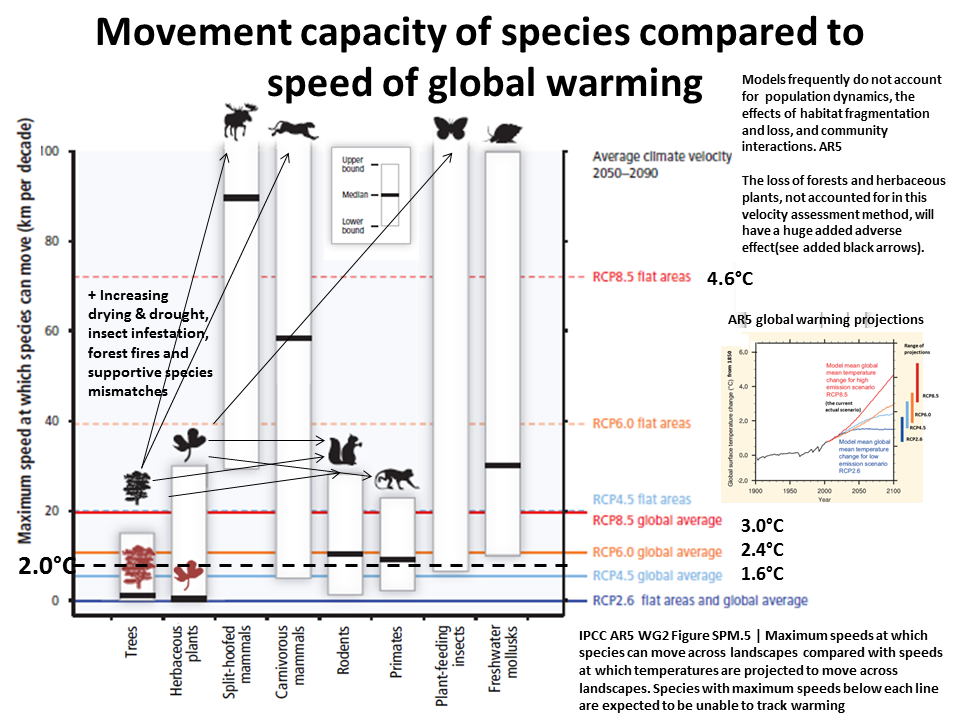
EXTINCTIONS Present climate change rate exceeds that of large extinctions
Natural global climate change at rates slower than current anthropogenic climate change caused significant ecosystem shifts and species extinctions during the past millions of years. (AR5 WG2 p. 4)
A large fraction of the species assessed is vulnerable to extinction due to climate change, often in interaction with other threats. Species with an intrinsically low
dispersal rate, especially when occupying flat landscapes where the projected climate velocity is high, and species in isolated habitats such as mountaintops, islands, or small protected areas are especially at risk. Cascading effects through organism interactions, especially those vulnerable to phenological changes, amplify risk (high confidence (AR5 WG2 Table TS4)
A large fraction of both terrestrial and freshwater species faces increased extinction risk under projected climate change during and beyond the 21st century, especially as climate change interacts with other stressors. [CURRENT RATE OF EXTINCTION IS 100 x NATURAL BACKGROUND RATE: S. Pimm, Science, May 2014.]
Extinction risk is increased under all RCP scenarios, with risk increasing with both magnitude and rate of climate change. (AR5 WG2 SPM p. 14)
The AR4 finding that 20–30% - more of the plant and animal species assessed are at increasing risk of extinction as global mean temperatures reach above 2.0C is confirmed (AR5 WG2 TS).
Trees and plants are the least able of species to survive globally warming.
Overall, many plant species are foreseen to be able to track climates only in mountainous areas at medium to high rates of warming. - i.e. in all but the best case RCP2.6 scenario plant species will only have climate space in mountains. When many other adverse effects of climate change are considered few plants will survive outside the high mountain elevations.
Abrupt irreversible regional damage, by 2100, under all but the best-case emissions scenario (RCP2.6)
Within this century, magnitudes and rates of climate change associated with medium- to high-emission scenarios (RCP4.5, 6.0,and 8.5) [i.e., all scenarios except the best-case RCP2.6] pose high risk of abrupt and irreversible regional-scale change in the composition, structure, and function of terrestrial and freshwater ecosystems, including wetlands. (AR5 WG2 SPM)
Multiple large sources of amplifying feedback
The carbon stock in global soils, including litter and peatlands is 1500 to 2400 PgC, with permanently frozen soils adding another 1700 PgC. The soil carbon stock is thus more than 10 times greater than the carbon stock in forest biomass (AR5 WG2 A 294)
Paleoecological records demonstrate with high confidence that the planet’s biota (both terrestrial and aquatic), carbon cycle, and associated feedbacks and services have responded to this climatic change, particularly when the climatic change was as large as that projected during the 21st century under mid- to high-end radiative forcing pathways - î.e. all but the best case RCP2.6 (AR5 WG2 A-280)
The paleo-climatic record reveals that past radiative climate forcing change was slower than that anticipated for the 21st century, but even these slower changes often drove surprisingly abrupt, nonlinear, regional-scale change in terrestrial and inland water systems (AR5 WG2 A 282).
The carbon taken up by intact and regrowing forests appears to have stabilized compared to the 1990s, after having increased in the 1970s and 1980s (Canadell et al., 2007; Pan et al., 2011). There is medium confidence that the terrestrial carbon sink is weakening. (AR5 WG2 A 302).
Extensive tree mortality and widespread forest die-backForest die-back and increasing forest fires are a huge source of amplifying carbon feedback. Recent indications are that temperate forests and trees are beginning to show signs of climate stress, including a reversal of tree growth enhancement in some regions AR5 WG2 4.3.3.1.2.)
Extensive tree mortality and widespread forest die-back (high mortality rates at a regional scale) linked to drought and temperature stress have been documented recently on all vegetated continents.
Arctic's enormous sources of amplifying feedbacks
There is very high confidence that the Arctic will warm most rapidly. (AR5 WG1 SPM)
Examples that could lead to substantial impact on climate [i.e., amplifying carbon feedback] are the boreal-tundra Arctic system and the Amazon forest. Carbon stored in the terrestrial biosphere (e.g., in peatlands, permafrost, and forests) is susceptible to loss to the atmosphere [i.e amplifying carbon feedback] as a result of climate change, deforestation, and ecosystem degradation (high confidence). Increased tree mortality and associated forest dieback is projected to occur in many regions over the 21st century, due to increased temperatures and drought. Forest dieback poses risks for carbon storage and biodiversity. (AR5 WG2 SPM p. 15)
Thawing permafrost could add another 1.5°C of global warming by 2100
Until the year 2100, up to 250 PgC [picograms of carbon] could be released as CO2, and up to 5 Pg as CH4. Given methane's stronger greenhouse warming potential, that corresponds to a further 100 PgC of equivalent CO2 released until the year 2100 [so 350PgC and about 1.5°C]. (AR5 WG1 FAQ 6.1)
Methane emissions could increase dramatically this century
Methane emissions, from Arctic thawing permafrost and subsea floor methane hydrates in the Arctic, could increase dramatically due to the rapid climate warming of the Arctic and these large carbon pools stored there. (AR5 WG1 FAQ 6.1)
Arctic amplifying feedback runaway risk
Should a sizeable fraction of this Arctic frozen carbon be released as methane and CO2, it would increase atmospheric concentrations, which would lead to higher atmospheric temperatures. That in turn would cause yet more methane and CO2 to be released, creating a positive feedback, which would further amplify global warming. (AR5 WG1 FAQ 6.1)
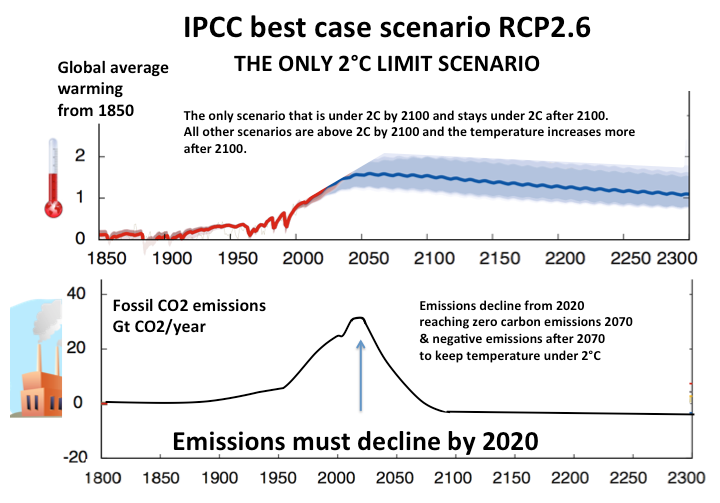
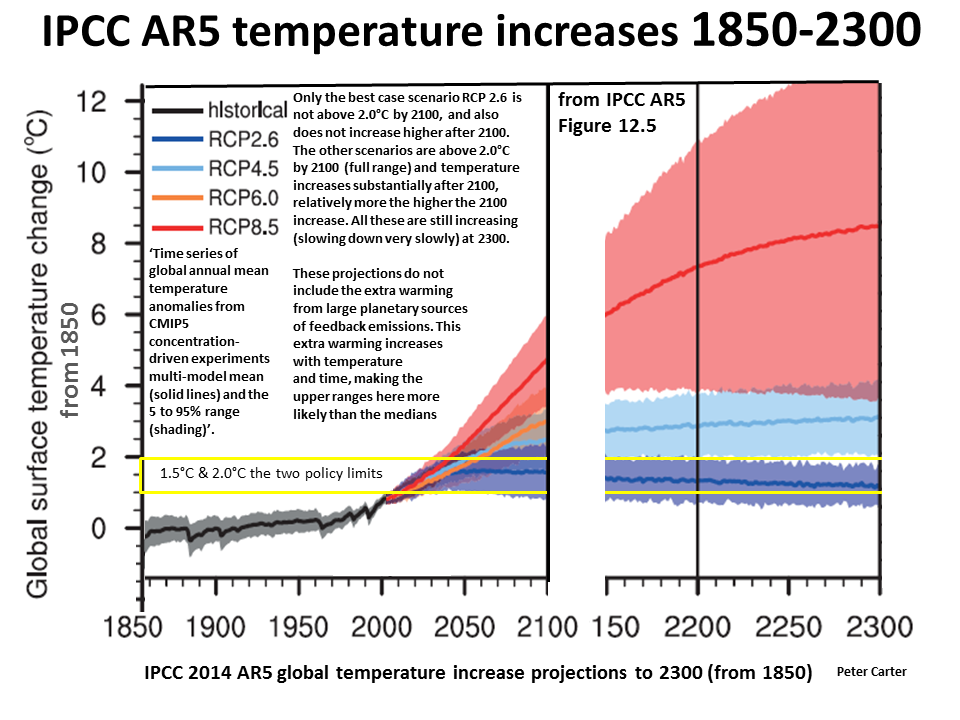
Only scenario to not exceed 2.0°C: best case emissions scenario RCP2.6
Global mean surface temperature increase by 2081–2100, relative to 1986–2005 will likely be in the 5 to 95% range of 0.3°C to 1.7°C for RCP2.6 (mean 1.0°C). This is 0.9°C to 2.3°C (mean 1.6°C). (AR5 WG1 TS.5.5.1)
Zero emissions required for mitigation
Pathways that are likely to limit warming to below 2°C relative to pre-industrial levels… would require substantial emissions reductions over the next few decades and near zero emissions of carbon dioxide and other long-lived greenhouse gases by the end of the century. (AR5 SYN SPM Headline Statements)
CO2 lasts ‘for ever’
The removal of all the human-emitted CO2 from the atmosphere by natural processes will take a few hundred thousand years (high confidence) (AR5 Ch6 6.1.1.1.)
AR5 deficiencies
Although it was intended that the AR5 would consider risk for future projections more than previous assessments the AR5 is still a computer model probability based assessment rather than risk based. The policy makers are being informed what the scientists are very confident will happen from their model projections with little attention and in some cases no attention given to many of the worst outcomes that could happen.
The most glaring and incredible omission is the very greatest risk, which is from multiple amplifying positive feedbacks.
The largest of these feedback sources are Arctic.
The AR5 omits all amplifying carbon feedbacks from its global warming projections.
The large Arctic snow-ice albedo feedback is not included.
The large wetland peat methane feedback is not included.
The large slower permafrost thaw feedback is included as an added source of atmospheric CO2 by 2100, but this is not included in the warming projections.
The potentially largest of all feedbacks from Arctic sub sea floor methane gas hydrate is not mentioned.
Other large feedbacks not included are Boreal forest die back, Amazon forest die back, and reduced CO2 uptake by green plants due to rising toxic ground level ozone with warming.
Carbon feedbacks can be accounted for by applying the new Earth system climate sensitivity which is at least 4.5C (for 2X atmospheric CO2) but the AR5 only uses the climate sensitivity of 3C that goes back to the very fist IPCC assessment in 1990.
Global warming projections
The AR5 uses very different (RCP) scenarios to the SRES scenarios that had been the basis of warming projections up to the 2007 AR4.
The assessment refers to the best case RCP2.6 scenario and the worst case RCP8.5 scenario.
The best case AR5 RCP scenario is better than the best case AR4 because it includes mitigation policy measures, unlike the AR4 SRES scenarios.
The worst case AR5 RCP8.5 mean warming is the same as the AR4 worst case A1FI. The upper range of A1FI is much higher than the upper range of RCP8.5, because the A1FI upper range includes carbon feedback warming and the RCP8.5 does not.
The RCPs do not include carbon cycle amplifying feedback added emissions and warming.
While the RCPs span a wide range of total forcing values, they do not cover the full range of emissions in the literature, particularly for aerosols.
Most of the CMIP5 and Earth System Model (ESM) simulations were performed with prescribed CO2 concentrations reaching 421 ppm (RCP2.6), by the year 2100.
Including also the prescribed concentrations of CH4 and N2O, the combined CO2-equivalent concentrations are 475 ppm (RCP2.6)..,
Near-term increases in seasonal mean and annual mean temperatures are expected to be larger in the tropics and subtropics than in mid-latitudes.
Increase of global mean surface temperatures for 2081–2100 relative to 1986–2005 is projected to be up to 4.8°C for the RCP8.5 worst case AR5 scenario, or 5.4C from 1850. How ever the AR5 omits all carbon cycle amplifying feedbacks from the warming projections.
The 2007 AR5 estimated terrestrial carbon feedback (no peat or Arctic carbon) to add more than another 1.0C for a high emissions scenario (A2).
So the true IPCC AR5 worst case is up to 6.4C and that excludes the huge carbon stores of wetland peat and Arctic carbon.
That is at least another 1.0C by 2100, so the real worst case warming is up to 7.4C.
The only AR5 scenario that stays below 2 degrees C is RCP2.6, making this best case scenario the only one to work towards for policy making. Anything higher than RCP2.6 will lead to global climate planetary catastrophe.
The Cryosphere Chapter
Over the last two decades, the Greenland and Antarctic ice sheets have been losing mass, glaciers have continued to shrink almost worldwide, and Arctic sea ice and Northern Hemisphere spring snow cover have continued to decrease in extent.
The average rate of ice loss from the Greenland ice sheet has very likely substantially increased from 34 Gt yr–1 over the period 1992–2001, to 215 Gt yr–1 over the period 2002–2011.
The average rate of ice loss from the Antarctic ice sheet has increased from 30 Gt yr–1 over the period 1992–2001 to 147 Gt yr–1 over the period 2002–2011.
The annual mean Arctic sea ice extent decreased over the period 1979–2012 with a rate that increased from 3.5 to 4.1% per decade (0.45 to 0.51 million km2 per decade), to 9.4 to 13.6% per decade (0.73 to 1.07 million km2 per decade) for the summer sea ice minimum.
The average decrease in decadal mean extent of Arctic sea ice has been most rapid in summer, when the spatial extent has decreased in every season, and in every successive decade since 1979.
Over the past three decades, Arctic summer sea ice retreat was unprecedented and Arctic sea surface temperatures were anomalously high in at least the last 1,450 years.
The extent of Northern Hemisphere snow cover has decreased since the mid-20th century. Northern Hemisphere snow cover extent decreased 1.6% per decade for March and April, and 11.7% per decade for June, over the 1967–2012 period.
Permafrost temperatures have increased in most regions since the early 1980s. Observed warming was up to 3°C in parts of Northern Alaska (early 1980s to mid-2000s) and up to 2°C in parts of the Russian European North (1971–2010).
In the latter region, a considerable reduction in permafrost thickness and areal extent has been observed over the period 1975–2005
Multiple lines of evidence support very substantial Arctic warming since the mid-20th century.
The rate of sea level rise since the mid-19th century has been larger than the mean rate during the previous two millennia.
Over the period 1901–2010, global mean sea level rose by 0.19 m.
The rate of global mean sea level rise has continued to increase since the early 20th century.
Projections
Arctic sea ice cover will continue to shrink and thin and Northern Hemisphere spring snow cover will decrease during the 21st century as global mean surface temperature rises. Global glacier volume will further decrease.
The area of Northern Hemisphere spring snow cover is projected to decrease by 7% for RCP2.6 and by 25% in RCP8.5 by the end of the 21st century for the model average.
Near-surface permafrost extent at high northern latitudes will be reduced as global mean surface temperature increases.
By the end of the 21st century, the area of permafrost near the surface (upper 3.5 m) is projected to decrease by between 37% (RCP2.6) to 81% (RCP8.5) for the model average.
By the end of the 21st century, the global glacier volume, is projected to decrease by 15 to 55% for RCP2.6, and by 35 to 85% for RCP8.5.
Sustained mass loss by ice sheets would cause larger sea level rise, and some part of the mass loss might be irreversible.
There is high confidence that sustained warming greater than some threshold would lead to the near-complete loss of the Greenland ice sheet over a millennium or more, causing a global mean sea level rise of up to 7 m.
Current estimates indicate that the threshold is greater than about 1°C but less than about 4°C global mean warming with respect to pre-industrial.
Abrupt and irreversible ice loss from a potential instability of marine-based sectors of the Antarctic Ice Sheet in response to climate forcing is possible, but current evidence and understanding is insufficient to make a quantitative assessment.
Carbon and Other Biogeochemical Cycles
The atmospheric concentrations of carbon dioxide (CO2), methane, and nitrous oxide have increased to levels unprecedented in at least the last 800,000 years.
CO2 concentrations have increased by 40% since pre-industrial times, primarily from fossil fuel emissions and secondarily from net land use change emissions.
The ocean has absorbed about 30% of the emitted anthropogenic carbon dioxide, causing ocean acidification.
Projections
Climate change will affect carbon cycle processes in a way that will exacerbate the increase of CO2 in the atmosphere. Further uptake of carbon by the ocean will increase ocean acidification.
A majority of models project a continued land carbon uptake under all RCPs, but some models simulate a land carbon loss due to the combined effect of climate change and land use change(i.e. amplifying +ve feedback).
Based on Earth System Models, there is high confidence that the feedback between climate and the carbon cycle is positive in the 21st century As a result more of the emitted anthropogenic CO2 will remain in the atmosphere- a positive feedback between climate and the carbon cycle.
Earth System Models project a global increase in ocean acidification for all RCP scenarios.
Cumulative CO2 emissions 20 for the 2012–2100 period compatible with the RCP atmospheric CO2 concentrations, as derived from 15 Earth System Models, range from 140 to 410 GtC for RCP2.6, to 1415 to 1910 GtC for RCP8.5 (excluding carbon feedback emissions from Amazon die back, wetland peat, and Arctivc carbon).
The release of CO2 or CH4 to the atmosphere from thawing permafrost carbon stocks over the 21st century is assessed to be in the range of 50 to 250 GtC for RCP8.5.
Climate Stabilization, Climate Change Commitment and Irreversibility
A large fraction of anthropogenic climate change resulting from CO2 emissions is irreversible on a multi-century to millennial time scale, except in the case of a large net removal of CO2 from the atmosphere over a sustained period. Surface temperatures will remain approximately constant at elevated levels for many centuries after a complete cessation of net anthropogenic CO2 emissions. Due to the long time scales of heat transfer from the ocean surface to depth, ocean warming will continue for centuries. Depending on the scenario, about 15 to 40% of emitted CO2 will remain in the atmosphere longer than 1,000 years.
Cumulative emissions of CO2 largely determine global mean surface warming by the late 21st century and beyond.
Most aspects of climate change will persist for many centuries even if emissions of CO2 are stopped.
This represents a substantial multi-century climate change commitment created by past, present and future emissions of CO2.
The following is absurdly misleading and not an assessment.
Limiting the warming caused by anthropogenic CO2 emissions alone with a probability of >33%, >50%, and >66% to less than 2°C since the period 1861–188022, will require cumulative CO2 emissions from all anthropogenic sources to stay between 0 and about 1560 GtC, 0 and about 1210 GtC, and 0 and about 1000 GtC since that period respectively.
These upper amounts are reduced to about 880 GtC, 840 GtC, and 800 GtC respectively, when accounting for non-CO2 forcings (ie. emissions of the other GHGs)
A lower warming target, or a higher likelihood of remaining below a specific warming target, will require lower cumulative CO2 emissions.
Accounting for warming effects of increases in non- CO2 greenhouse gases (ie. emissions of the other GHGs) reductions in aerosols (fossil fuel air pollution cooling aerosols have to be reduced (air quality) and stopped to stabilize global temperature and ocean acidification) , or the release of greenhouse gases from permafrost will also lower the cumulative CO2 emissions for a specific warming target.
Compiled by Peter Carter
Already committed (locked-in) future climate change
o The commitment from constant greenhouse gas concentrations would correspond to approximately 2°C warming. (AR5 WG1 12.5.4.2)
o Many aspects of climate change will persist for centuries even if concentrations of greenhouse gases are stabilised. This represents a substantial multi-century commitment created by human activities today. (AR5 WG1 SPM)
o Global temperature equilibrium would be reached only after centuries to millennia if RF [radiative forcing or climate system heat] were stabilized. (AR5 WG1 Chapter 12 Executive Summary)
Extreme increase of atmospheric greenhouse gasesMultiple lines of evidence confirm that the long-lived greenhouse gases CO2, CH4, N2O all have increased substantially since 1750. There is very high confidence that they now exceed by 30%, 125%, 8%, respectively, the range of variability recorded in ice core records during past 800,000 years.
Planetary catastrophe warming risk by 2100
Risk of warming up to an unlivable 7.8°C by 2100
Without additional efforts to reduce GHG emissions, global mean surface temperature increases in 2100 from 3.7 to 4.8°C with a range to 7.8°C when including climate uncertainty. (AR5 WG3 SPM p. 8) ["Uncertainties" include the large sources of amplifying feedbacks that are not included in the AR5 global warming projections; these feedbacks are actually certain.]
Impacts to all continents and all oceans
In recent decades, changes in climate have caused impacts on natural and human systems on all continents and across the oceans. (AR5 WG2 SPM p. 4)
Climate change amplifies risks
Climate change is projected to amplify existing climate-related risks and create new risks for natural and human systems. Some of these risks will be limited to a particular sector or region, and others will have cascading effects. (WG2 SPM)
Drinking-water impacts
Freshwater-related risks of climate change increase significantly with increasing greenhouse gas concentrations. Climate change is projected to reduce raw water quality and pose risks to drinking water quality even with conventional treatment, due to interacting factors: increased temperature; increased sediment, nutrient, and pollutant loadings from heavy rainfall; increased concentration of pollutants during droughts; and disruption of treatment facilities during floods. The fraction of global population experiencing water scarcity and the fraction affected by major river floods increase with the level of warming in the 21st century. (AR5 WG2 SPM)
Urban populations
Heat stress, extreme precipitation, inland and coastal flooding, landslides, air pollution, drought, and water scarcity pose risks in urban areas for people, assets, economies, and ecosystems (very high confidence). (AR5 WG2 SPM)
Increasing extreme events
o Impacts from recent climate-related extremes, such as heat waves, droughts, floods, cyclones, and wildfires, reveal significant vulnerability and exposure of some ecosystems and many human systems to current climate variability. (AR5 WG2
SPM p. 6)
o It is very likely that anthropogenic forcing has contributed to the observed changes in daily temperature extremes since the mid-20th century. […] Models project increases in the duration, intensity and spatial extent of heat-waves. (AR5 WG1 SPM)
o More severe and/or frequent extreme weather events and/or hazard types are projected to increase losses and loss variability in various regions and challenge insurance systems to offer affordable coverage. (AR5 WG2 SPM)
Unique and vulnerable ecosystems and cultures
Some unique and threatened systems, including ecosystems and cultures, are already at risk from climate change and the number of such systems at risk of severe consequences is high at 1.6°C. (AR5 WG2 SPM)
PLANETARY CATASTROPHIC EFFECTS
Tipping points
With increasing warming from today, some ecosystems may be at risk of abrupt and irreversible changes. (AR5 WG2 SPM)
Abrupt Change
Several components or phenomena in the climate system could potentially exhibit abrupt or nonlinear changes, and some are known to have done so in the past. (AR5 WG1 Chapter 12)
Severe pervasive irreversible impacts
Increasing magnitudes of warming increase the likelihood of severe, pervasive, and irreversible impacts. (AR5 WG2 SPM p. 14)
Greenland ice sheet
There is high confidence that sustained warming greater than some threshold would lead to the near-complete loss of the Greenland ice sheet over a millennium or more, causing a global mean sea level rise of up to 7 m. Current estimates indicate that the threshold is greater than about 1°C... with respect to pre-industrial.(AR5 WG2 SPM)
Amplifying positive feedback Adds up to an extra 2.0C by 2100 The feedback between climate and the carbon cycle is positive in the 21st century and beyond. Models indicate a loss of carbon of 59 [20 to 98] PgC and 17 [13 to 21] PgC per °C warming from the land and the ocean, respectively [this is about 0.5C by 2100, but does not include large forest die-back, peat-lands and large Arctic feedback sources].
Permafrost feedback Until the year 2100, up to 250 PgC [picograms of carbon] could be released as CO2, and up to 5 Pg as CH4. Given methane's stronger greenhouse warming potential, that corresponds to a further 100 PgC of equivalent CO2 released until the year 2100 [so 350 PgC and about 1.5°C]. (AR5 WG1 FAQ 6.1)
FOOD INSECURITY
Negative effect on most crops already
Based on many studies covering a wide range of regions and crops, negative impacts of climate change on crop yields have been more common than positive impacts. (AR5 WG2 SPM p. 4)
Committed to declines of crops in all main food producing regions 1.0C
Above 1.0°C all crops in all regions decline [the policy makers changed this in the Summary for Policymakers,making it confusing]
Temperature increases in excess of about 1 degree C above pre-industrial [are] projected to have negative effects on yields for the major crops (wheat, rice and maize) in both tropical and temperate regions. (AR5 WG2 final science draft, Chapter 7, p.3)
Animal displacements will cause ... a drop in the fisheries of 40 to 60% in some of the tropics, for 2°C warming above pre-industrial levels (AR5 TS -68).
The future this century:
• reduced economic growth
• increased poverty
• reduced food security & increased hunger
Throughout the 21st century, climate-change impacts are projected to slow down economic growth, make poverty reduction more difficult, further erode food security, and prolong existing and create new poverty traps, the latter particularly in urban areas and emerging hotspots of hunger. (AR5 WG2 SPM p. 20)
Ocean acidification to be highly damaging to most marine life
[For all scenarios but the best-case (RCP2.6) emissions scenario],ocean acidification poses substantial risks to marine ecosystems, especially polar ecosystems and coral reefs, associated with impacts on the physiology, behavior, and population dynamics of individual species from phytoplankton to animals. […] Ocean acidification acts together with other global changes (e.g., warming, decreasing oxygen levels) and with local changes (e.g., pollution, eutrophication [algae overgrowth]) (high confidence). (AR5 WG2 SPM)
Ocean mass extinctions in Earth history occurred during much slower rates of ocean acidification, combined with other drivers changing, suggesting that evolutionary rates are not fast enough for sensitive ocean animals and plants to adapt to the projected rate of future change (AR5 WG2 130)
Combined multiple damaging effects on the oceans
Simultaneous drivers, such as warming and ocean acidification, can lead to interactive, complex, and amplified impacts for species and ecosystems. (AR5 WG2 SPM)
[Another such damaging driver is that some ocean oxygen levels are declining and there is] high agreement among modeling studies that O2 concentrations will continue to decrease in most parts of the Ocean due to the effect of temperature. (AR5 WG2 Technical Summary)
Increasing violent conflicts
Climate change can indirectly increase risks of violent conflicts in the form of civil war and inter-group violence by amplifying well-documented drivers of these conflicts such as poverty and economic shocks. Multiple lines of evidence relate climate variability to these forms of conflict. (AR5 WG2 SPM p. 20)
Considerable risks above 1°C Some risks of climate change are considerable at 1 or 2°C above pre-industrial levels. (AR5 WG2 SPM p. 14)
EXTINCTIONS Present climate change rate exceeds that of large extinctions
Natural global climate change at rates slower than current anthropogenic climate change caused significant ecosystem shifts and species extinctions during the past millions of years. (AR5 WG2 p. 4)
A large fraction of the species assessed is vulnerable to extinction due to climate change, often in interaction with other threats. Species with an intrinsically low
dispersal rate, especially when occupying flat landscapes where the projected climate velocity is high, and species in isolated habitats such as mountaintops, islands, or small protected areas are especially at risk. Cascading effects through organism interactions, especially those vulnerable to phenological changes, amplify risk (high confidence (AR5 WG2 Table TS4)
A large fraction of both terrestrial and freshwater species faces increased extinction risk under projected climate change during and beyond the 21st century, especially as climate change interacts with other stressors. [CURRENT RATE OF EXTINCTION IS 100 x NATURAL BACKGROUND RATE: S. Pimm, Science, May 2014.]
Extinction risk is increased under all RCP scenarios, with risk increasing with both magnitude and rate of climate change. (AR5 WG2 SPM p. 14)
The AR4 finding that 20–30% - more of the plant and animal species assessed are at increasing risk of extinction as global mean temperatures reach above 2.0C is confirmed (AR5 WG2 TS).
Trees and plants are the least able of species to survive globally warming.
Overall, many plant species are foreseen to be able to track climates only in mountainous areas at medium to high rates of warming. - i.e. in all but the best case RCP2.6 scenario plant species will only have climate space in mountains. When many other adverse effects of climate change are considered few plants will survive outside the high mountain elevations.
Abrupt irreversible regional damage, by 2100, under all but the best-case emissions scenario (RCP2.6)
Within this century, magnitudes and rates of climate change associated with medium- to high-emission scenarios (RCP4.5, 6.0,and 8.5) [i.e., all scenarios except the best-case RCP2.6] pose high risk of abrupt and irreversible regional-scale change in the composition, structure, and function of terrestrial and freshwater ecosystems, including wetlands. (AR5 WG2 SPM)
Multiple large sources of amplifying feedback
The carbon stock in global soils, including litter and peatlands is 1500 to 2400 PgC, with permanently frozen soils adding another 1700 PgC. The soil carbon stock is thus more than 10 times greater than the carbon stock in forest biomass (AR5 WG2 A 294)
Paleoecological records demonstrate with high confidence that the planet’s biota (both terrestrial and aquatic), carbon cycle, and associated feedbacks and services have responded to this climatic change, particularly when the climatic change was as large as that projected during the 21st century under mid- to high-end radiative forcing pathways - î.e. all but the best case RCP2.6 (AR5 WG2 A-280)
The paleo-climatic record reveals that past radiative climate forcing change was slower than that anticipated for the 21st century, but even these slower changes often drove surprisingly abrupt, nonlinear, regional-scale change in terrestrial and inland water systems (AR5 WG2 A 282).
The carbon taken up by intact and regrowing forests appears to have stabilized compared to the 1990s, after having increased in the 1970s and 1980s (Canadell et al., 2007; Pan et al., 2011). There is medium confidence that the terrestrial carbon sink is weakening. (AR5 WG2 A 302).
Extensive tree mortality and widespread forest die-backForest die-back and increasing forest fires are a huge source of amplifying carbon feedback. Recent indications are that temperate forests and trees are beginning to show signs of climate stress, including a reversal of tree growth enhancement in some regions AR5 WG2 4.3.3.1.2.)
Extensive tree mortality and widespread forest die-back (high mortality rates at a regional scale) linked to drought and temperature stress have been documented recently on all vegetated continents.
Arctic's enormous sources of amplifying feedbacks
There is very high confidence that the Arctic will warm most rapidly. (AR5 WG1 SPM)
Examples that could lead to substantial impact on climate [i.e., amplifying carbon feedback] are the boreal-tundra Arctic system and the Amazon forest. Carbon stored in the terrestrial biosphere (e.g., in peatlands, permafrost, and forests) is susceptible to loss to the atmosphere [i.e amplifying carbon feedback] as a result of climate change, deforestation, and ecosystem degradation (high confidence). Increased tree mortality and associated forest dieback is projected to occur in many regions over the 21st century, due to increased temperatures and drought. Forest dieback poses risks for carbon storage and biodiversity. (AR5 WG2 SPM p. 15)
Thawing permafrost could add another 1.5°C of global warming by 2100
Until the year 2100, up to 250 PgC [picograms of carbon] could be released as CO2, and up to 5 Pg as CH4. Given methane's stronger greenhouse warming potential, that corresponds to a further 100 PgC of equivalent CO2 released until the year 2100 [so 350PgC and about 1.5°C]. (AR5 WG1 FAQ 6.1)
Methane emissions could increase dramatically this century
Methane emissions, from Arctic thawing permafrost and subsea floor methane hydrates in the Arctic, could increase dramatically due to the rapid climate warming of the Arctic and these large carbon pools stored there. (AR5 WG1 FAQ 6.1)
Arctic amplifying feedback runaway risk
Should a sizeable fraction of this Arctic frozen carbon be released as methane and CO2, it would increase atmospheric concentrations, which would lead to higher atmospheric temperatures. That in turn would cause yet more methane and CO2 to be released, creating a positive feedback, which would further amplify global warming. (AR5 WG1 FAQ 6.1)
Only scenario to not exceed 2.0°C: best case emissions scenario RCP2.6
Global mean surface temperature increase by 2081–2100, relative to 1986–2005 will likely be in the 5 to 95% range of 0.3°C to 1.7°C for RCP2.6 (mean 1.0°C). This is 0.9°C to 2.3°C (mean 1.6°C). (AR5 WG1 TS.5.5.1)
Zero emissions required for mitigation
Pathways that are likely to limit warming to below 2°C relative to pre-industrial levels… would require substantial emissions reductions over the next few decades and near zero emissions of carbon dioxide and other long-lived greenhouse gases by the end of the century. (AR5 SYN SPM Headline Statements)
CO2 lasts ‘for ever’
The removal of all the human-emitted CO2 from the atmosphere by natural processes will take a few hundred thousand years (high confidence) (AR5 Ch6 6.1.1.1.)
AR5 deficiencies
Although it was intended that the AR5 would consider risk for future projections more than previous assessments the AR5 is still a computer model probability based assessment rather than risk based. The policy makers are being informed what the scientists are very confident will happen from their model projections with little attention and in some cases no attention given to many of the worst outcomes that could happen.
The most glaring and incredible omission is the very greatest risk, which is from multiple amplifying positive feedbacks.
The largest of these feedback sources are Arctic.
The AR5 omits all amplifying carbon feedbacks from its global warming projections.
The large Arctic snow-ice albedo feedback is not included.
The large wetland peat methane feedback is not included.
The large slower permafrost thaw feedback is included as an added source of atmospheric CO2 by 2100, but this is not included in the warming projections.
The potentially largest of all feedbacks from Arctic sub sea floor methane gas hydrate is not mentioned.
Other large feedbacks not included are Boreal forest die back, Amazon forest die back, and reduced CO2 uptake by green plants due to rising toxic ground level ozone with warming.
Carbon feedbacks can be accounted for by applying the new Earth system climate sensitivity which is at least 4.5C (for 2X atmospheric CO2) but the AR5 only uses the climate sensitivity of 3C that goes back to the very fist IPCC assessment in 1990.
Global warming projections
The AR5 uses very different (RCP) scenarios to the SRES scenarios that had been the basis of warming projections up to the 2007 AR4.
The assessment refers to the best case RCP2.6 scenario and the worst case RCP8.5 scenario.
The best case AR5 RCP scenario is better than the best case AR4 because it includes mitigation policy measures, unlike the AR4 SRES scenarios.
The worst case AR5 RCP8.5 mean warming is the same as the AR4 worst case A1FI. The upper range of A1FI is much higher than the upper range of RCP8.5, because the A1FI upper range includes carbon feedback warming and the RCP8.5 does not.
The RCPs do not include carbon cycle amplifying feedback added emissions and warming.
While the RCPs span a wide range of total forcing values, they do not cover the full range of emissions in the literature, particularly for aerosols.
Most of the CMIP5 and Earth System Model (ESM) simulations were performed with prescribed CO2 concentrations reaching 421 ppm (RCP2.6), by the year 2100.
Including also the prescribed concentrations of CH4 and N2O, the combined CO2-equivalent concentrations are 475 ppm (RCP2.6)..,
Near-term increases in seasonal mean and annual mean temperatures are expected to be larger in the tropics and subtropics than in mid-latitudes.
Increase of global mean surface temperatures for 2081–2100 relative to 1986–2005 is projected to be up to 4.8°C for the RCP8.5 worst case AR5 scenario, or 5.4C from 1850. How ever the AR5 omits all carbon cycle amplifying feedbacks from the warming projections.
The 2007 AR5 estimated terrestrial carbon feedback (no peat or Arctic carbon) to add more than another 1.0C for a high emissions scenario (A2).
So the true IPCC AR5 worst case is up to 6.4C and that excludes the huge carbon stores of wetland peat and Arctic carbon.
That is at least another 1.0C by 2100, so the real worst case warming is up to 7.4C.
The only AR5 scenario that stays below 2 degrees C is RCP2.6, making this best case scenario the only one to work towards for policy making. Anything higher than RCP2.6 will lead to global climate planetary catastrophe.
The Cryosphere Chapter
Over the last two decades, the Greenland and Antarctic ice sheets have been losing mass, glaciers have continued to shrink almost worldwide, and Arctic sea ice and Northern Hemisphere spring snow cover have continued to decrease in extent.
The average rate of ice loss from the Greenland ice sheet has very likely substantially increased from 34 Gt yr–1 over the period 1992–2001, to 215 Gt yr–1 over the period 2002–2011.
The average rate of ice loss from the Antarctic ice sheet has increased from 30 Gt yr–1 over the period 1992–2001 to 147 Gt yr–1 over the period 2002–2011.
The annual mean Arctic sea ice extent decreased over the period 1979–2012 with a rate that increased from 3.5 to 4.1% per decade (0.45 to 0.51 million km2 per decade), to 9.4 to 13.6% per decade (0.73 to 1.07 million km2 per decade) for the summer sea ice minimum.
The average decrease in decadal mean extent of Arctic sea ice has been most rapid in summer, when the spatial extent has decreased in every season, and in every successive decade since 1979.
Over the past three decades, Arctic summer sea ice retreat was unprecedented and Arctic sea surface temperatures were anomalously high in at least the last 1,450 years.
The extent of Northern Hemisphere snow cover has decreased since the mid-20th century. Northern Hemisphere snow cover extent decreased 1.6% per decade for March and April, and 11.7% per decade for June, over the 1967–2012 period.
Permafrost temperatures have increased in most regions since the early 1980s. Observed warming was up to 3°C in parts of Northern Alaska (early 1980s to mid-2000s) and up to 2°C in parts of the Russian European North (1971–2010).
In the latter region, a considerable reduction in permafrost thickness and areal extent has been observed over the period 1975–2005
Multiple lines of evidence support very substantial Arctic warming since the mid-20th century.
The rate of sea level rise since the mid-19th century has been larger than the mean rate during the previous two millennia.
Over the period 1901–2010, global mean sea level rose by 0.19 m.
The rate of global mean sea level rise has continued to increase since the early 20th century.
Projections
Arctic sea ice cover will continue to shrink and thin and Northern Hemisphere spring snow cover will decrease during the 21st century as global mean surface temperature rises. Global glacier volume will further decrease.
The area of Northern Hemisphere spring snow cover is projected to decrease by 7% for RCP2.6 and by 25% in RCP8.5 by the end of the 21st century for the model average.
Near-surface permafrost extent at high northern latitudes will be reduced as global mean surface temperature increases.
By the end of the 21st century, the area of permafrost near the surface (upper 3.5 m) is projected to decrease by between 37% (RCP2.6) to 81% (RCP8.5) for the model average.
By the end of the 21st century, the global glacier volume, is projected to decrease by 15 to 55% for RCP2.6, and by 35 to 85% for RCP8.5.
Sustained mass loss by ice sheets would cause larger sea level rise, and some part of the mass loss might be irreversible.
There is high confidence that sustained warming greater than some threshold would lead to the near-complete loss of the Greenland ice sheet over a millennium or more, causing a global mean sea level rise of up to 7 m.
Current estimates indicate that the threshold is greater than about 1°C but less than about 4°C global mean warming with respect to pre-industrial.
Abrupt and irreversible ice loss from a potential instability of marine-based sectors of the Antarctic Ice Sheet in response to climate forcing is possible, but current evidence and understanding is insufficient to make a quantitative assessment.
Carbon and Other Biogeochemical Cycles
The atmospheric concentrations of carbon dioxide (CO2), methane, and nitrous oxide have increased to levels unprecedented in at least the last 800,000 years.
CO2 concentrations have increased by 40% since pre-industrial times, primarily from fossil fuel emissions and secondarily from net land use change emissions.
The ocean has absorbed about 30% of the emitted anthropogenic carbon dioxide, causing ocean acidification.
Projections
Climate change will affect carbon cycle processes in a way that will exacerbate the increase of CO2 in the atmosphere. Further uptake of carbon by the ocean will increase ocean acidification.
A majority of models project a continued land carbon uptake under all RCPs, but some models simulate a land carbon loss due to the combined effect of climate change and land use change(i.e. amplifying +ve feedback).
Based on Earth System Models, there is high confidence that the feedback between climate and the carbon cycle is positive in the 21st century As a result more of the emitted anthropogenic CO2 will remain in the atmosphere- a positive feedback between climate and the carbon cycle.
Earth System Models project a global increase in ocean acidification for all RCP scenarios.
Cumulative CO2 emissions 20 for the 2012–2100 period compatible with the RCP atmospheric CO2 concentrations, as derived from 15 Earth System Models, range from 140 to 410 GtC for RCP2.6, to 1415 to 1910 GtC for RCP8.5 (excluding carbon feedback emissions from Amazon die back, wetland peat, and Arctivc carbon).
The release of CO2 or CH4 to the atmosphere from thawing permafrost carbon stocks over the 21st century is assessed to be in the range of 50 to 250 GtC for RCP8.5.
Climate Stabilization, Climate Change Commitment and Irreversibility
A large fraction of anthropogenic climate change resulting from CO2 emissions is irreversible on a multi-century to millennial time scale, except in the case of a large net removal of CO2 from the atmosphere over a sustained period. Surface temperatures will remain approximately constant at elevated levels for many centuries after a complete cessation of net anthropogenic CO2 emissions. Due to the long time scales of heat transfer from the ocean surface to depth, ocean warming will continue for centuries. Depending on the scenario, about 15 to 40% of emitted CO2 will remain in the atmosphere longer than 1,000 years.
Cumulative emissions of CO2 largely determine global mean surface warming by the late 21st century and beyond.
Most aspects of climate change will persist for many centuries even if emissions of CO2 are stopped.
This represents a substantial multi-century climate change commitment created by past, present and future emissions of CO2.
The following is absurdly misleading and not an assessment.
Limiting the warming caused by anthropogenic CO2 emissions alone with a probability of >33%, >50%, and >66% to less than 2°C since the period 1861–188022, will require cumulative CO2 emissions from all anthropogenic sources to stay between 0 and about 1560 GtC, 0 and about 1210 GtC, and 0 and about 1000 GtC since that period respectively.
These upper amounts are reduced to about 880 GtC, 840 GtC, and 800 GtC respectively, when accounting for non-CO2 forcings (ie. emissions of the other GHGs)
A lower warming target, or a higher likelihood of remaining below a specific warming target, will require lower cumulative CO2 emissions.
Accounting for warming effects of increases in non- CO2 greenhouse gases (ie. emissions of the other GHGs) reductions in aerosols (fossil fuel air pollution cooling aerosols have to be reduced (air quality) and stopped to stabilize global temperature and ocean acidification) , or the release of greenhouse gases from permafrost will also lower the cumulative CO2 emissions for a specific warming target.
2017 Royal Society AR5 update
Planetary emergency proof
The IPCC 5th assessment provides overwhelming evidence of the planetary emergency situation.
Synthesis Headline Statements (just 2 pages)
VIDEO IPCC AR5 WG 1 by Yale Forum With some interesting background. Climate scientists Michael Mann and Stefan Rahmstorf offer a description of some key points made in the IPCC Working Group 1 science report
VIDEO IPCC WG1 by lead authors This covers some of the scientific findings.
The IPCC mandate
The IPCC was established in 1988 with the role of assessing the scientific, technical and socio-economic information relevant for understanding the risk of human-induced climate change.
The IPCC has three Working Groups and a Task Force. Working Group I (WGI) assesses the science
WGII assesses impacts, vulnerability and adaptation of socio-economic and natural systems
WGIII assesses the mitigation options for limiting greenhouse gas emissions.
SPM The short IPCC reports that the call's summaries for policy makers (SPM) these are the (only) reports that count in government policy making and international climate change discussions.